Hens support calves in their critical first phase of life
By Dr. Inge Heinzl, EW Nutrition
Calves are particularly susceptible to disease because ruminants have a multilayered placenta (placenta epitheliochorialis), and transplacental transfer of immunoglobulins is either absent or occurs only to a very limited extent. This means that the animals must build up their own defenses during the first weeks of life and depend on the immunological support provided by maternal colostrum. Its intake, therefore, is vital. Several studies evaluating the immunoglobulin Y (IgY) supply in calves have shown that not all calves have sufficient immunoglobulins to withstand disease challenges, especially diarrhea.
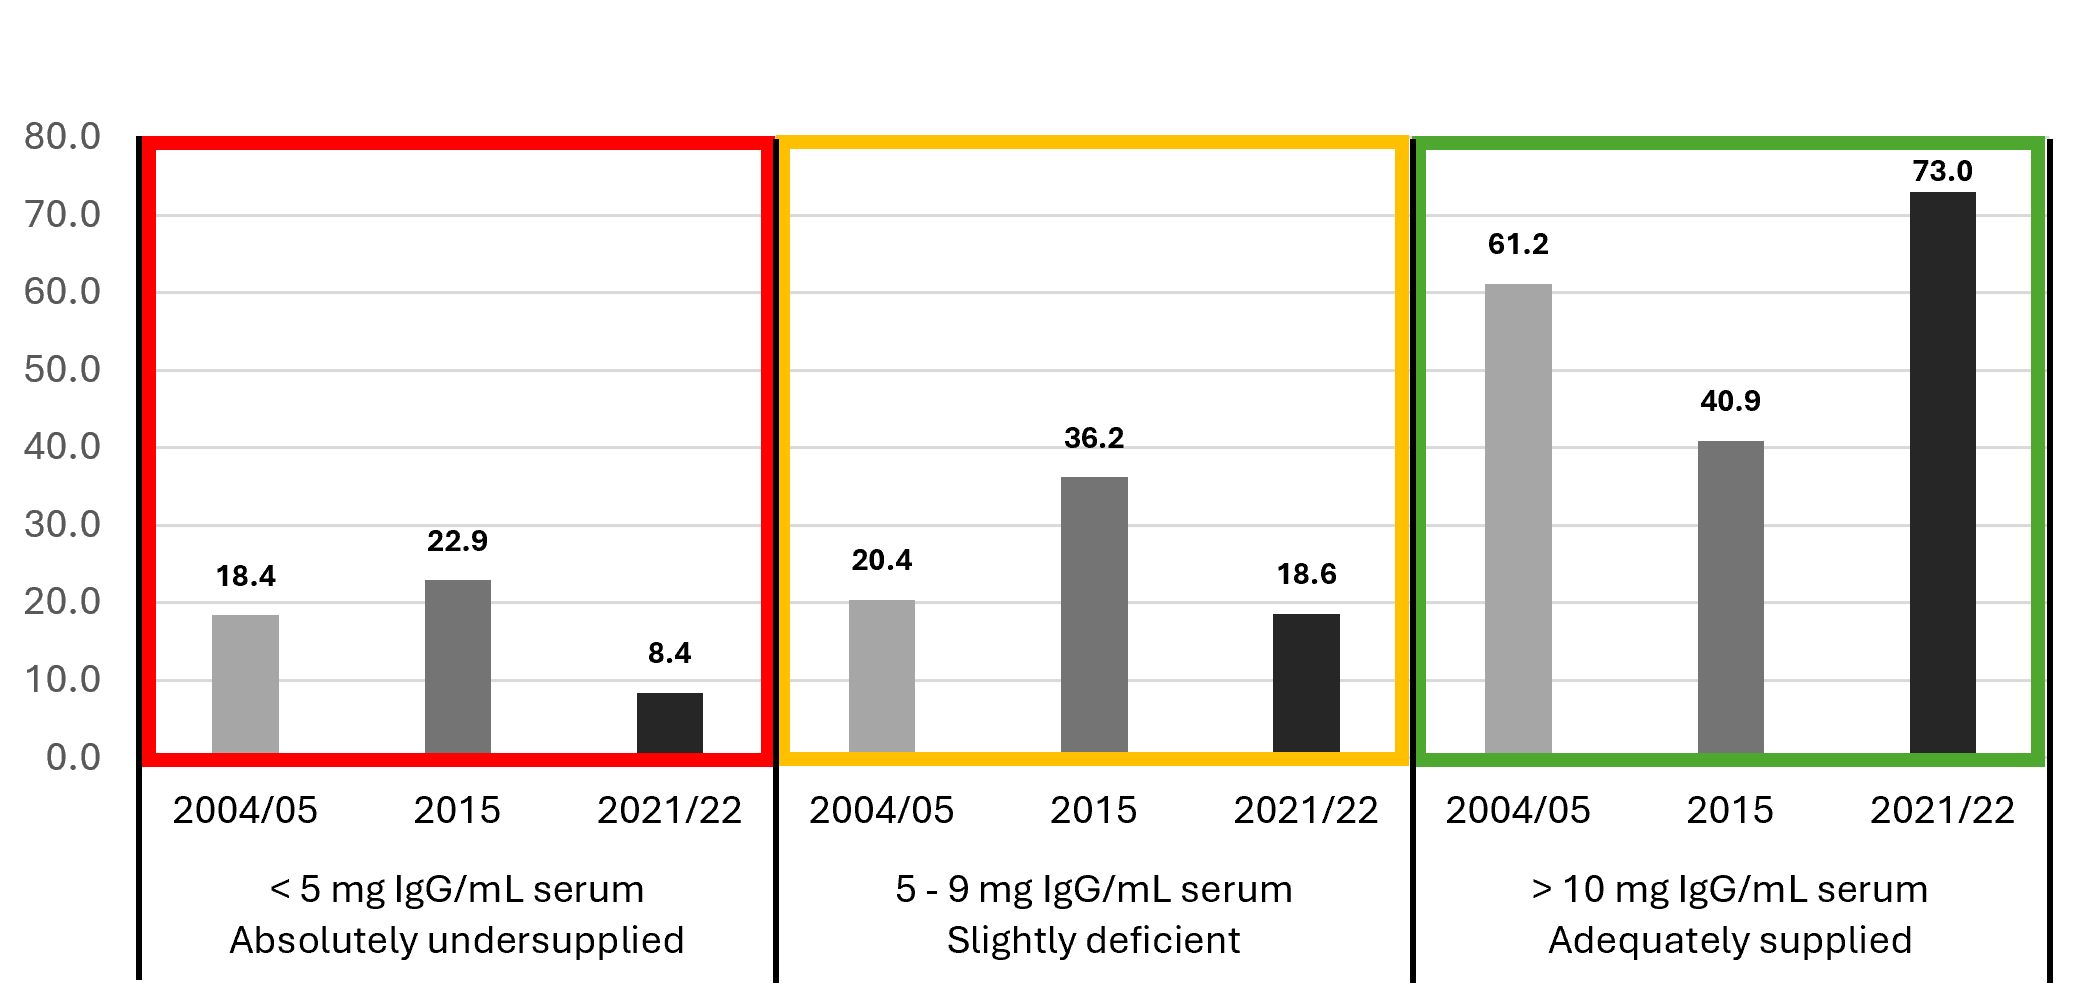
Insufficient intake of colostrum or colostrum with an inadequate content of relevant antibodies leads to failure of passive transfer in calves (Figure 1).
Figure 1: IgG supply of calves – Comparison 2004/05, 2015, and 2021/22 (2004/05: E.K. McMorran, 2006; 2015: K. Stemme et al., 2016; 2021/22: K. Stemme et al., 2022)
Old method – newly applied
To generally support young animals, and especially runts, it was common practice in “the good old days” to feed them raw chicken eggs. Back then, people may not have always known why, but it helped. Dr. Felix Klemperer (1893) provided the explanation. He discovered that chickens form antibodies against a wide variety of germs – not just chicken-relevant ones – they come into contact with and then transfer these antibodies into the egg.
Since, in the past, all animals were kept under one roof, chickens were also exposed to the diarrhea-causing pathogens of all animals living on the farm. Without becoming sick themselves, they formed immunoglobulins (IgY = immunoglobulins from the egg yolk) against these pathogens and transferred them to the egg – the only way to provide their offspring with an immunological head start.
Advantages of egg immunoglobulins: They work not only in birds but can also support mammals immunologically against diarrheal diseases (Yokoyama et al., 1992; Yokoyama et al., 1993; Ikemori et al., 1992; Kuroki et al., 1993; Kellner et al., 1994; Ehrhard et al., 1993; Kuroki, 1999), and they can be produced in high quantities without wounding or killing the hens.
Modern technology enables the provision of complementary dietary feeds containing egg immunoglobulins, supporting calves…and also other young animals suffering from failure of passive transfer (FPT) to overcome critical phases of life.
Egg immunoglobulins mainly act in the gut. There, they bind to pathogens such as E. coli, Cryptosporidia, rotaviruses, and coronaviruses.
Field trials prove the efficacy of egg immunoglobulins
Several trials were conducted in the field to evaluate the efficacy of egg immunoglobulins in calf rearing.
1. Lower number of treatments and decreased mortality rate
A trial conducted in the Netherlands with 300 veal calves (Holstein Friesian and Brown Swiss) examined the effect of egg immunoglobulins on the number of treatments and mortality rate. Both groups were fed standard milk replacer. The IgY group additionally received decreasing amounts of an IgY-containing product (Globigen Life Start).
Days 1-3: 16 g
Days 4-7: 8 g
Days 8-14: 4 g, and
Weeks 3-28: 0.4 g /animal/day.
Results:
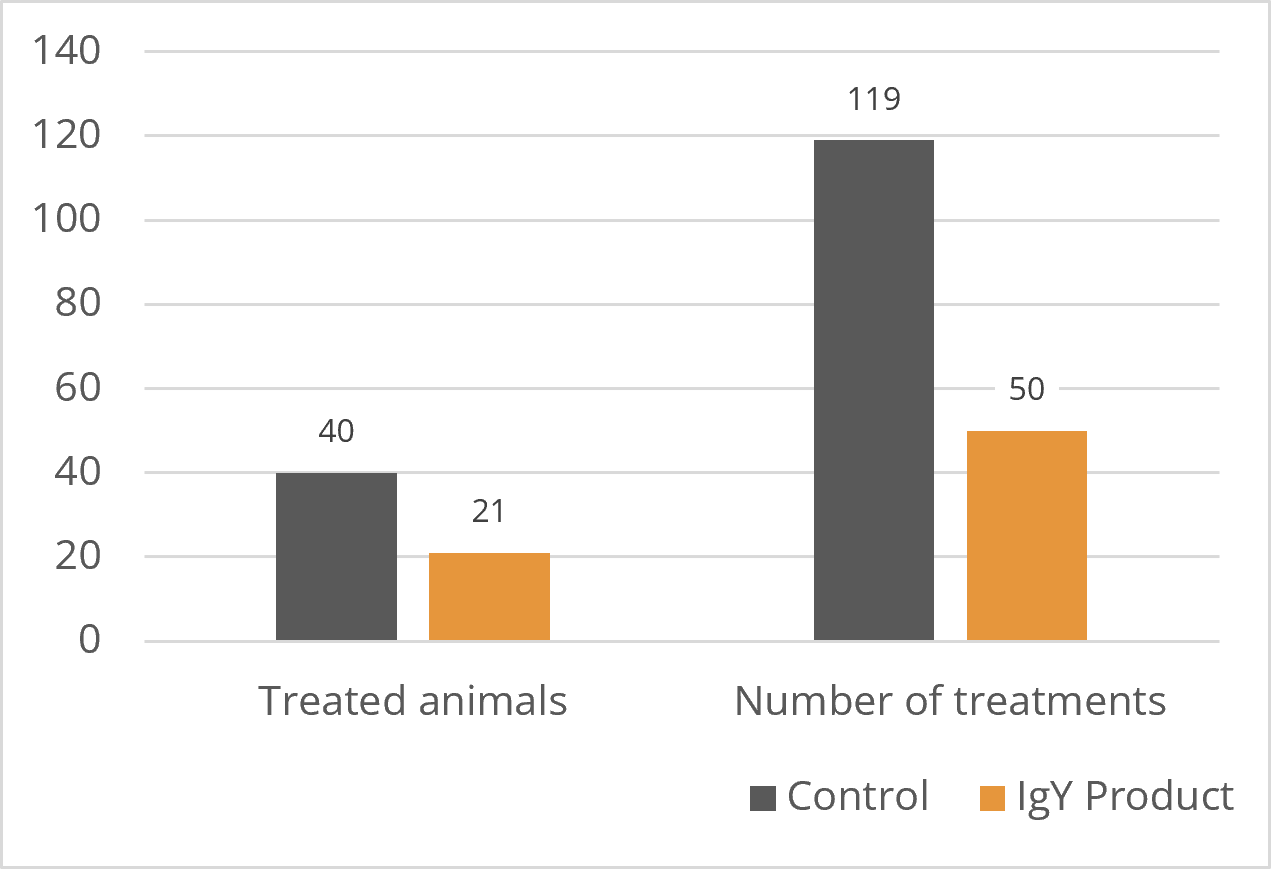
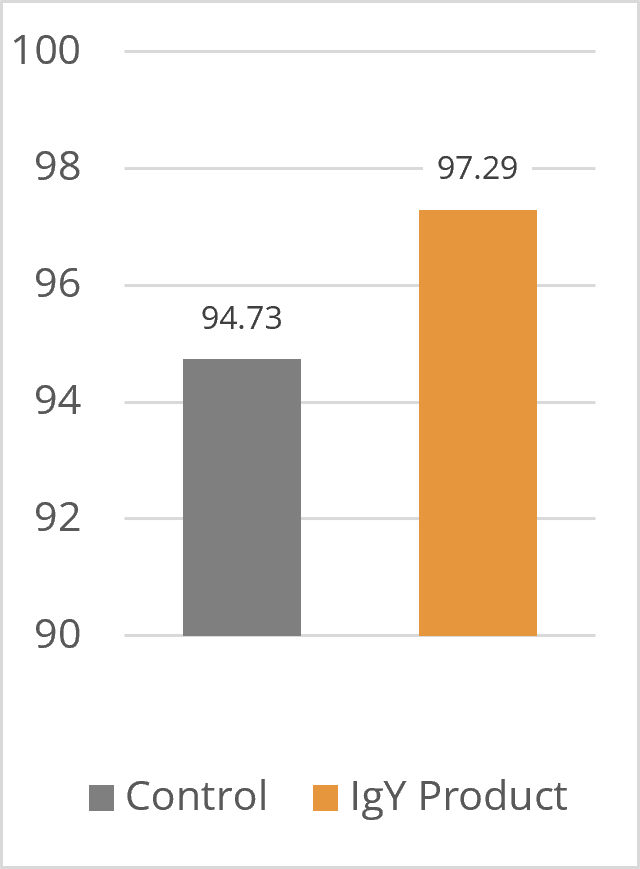
In the group fed the IgY product, nearly 50% fewer animals (21 vs. 40) required medical treatment, and the number of treatments also decreased significantly, from 119 in the control to 50 in the Globigen Life Start group. Better health status resulted in a 2.5% higher livability rate in the group receiving the IgY Product (97.29% vs. 94.73% in the control).
Figure 2: Treated animals and number of treatments (n)
Figure 3: Livability (%)
2. Improved weight development
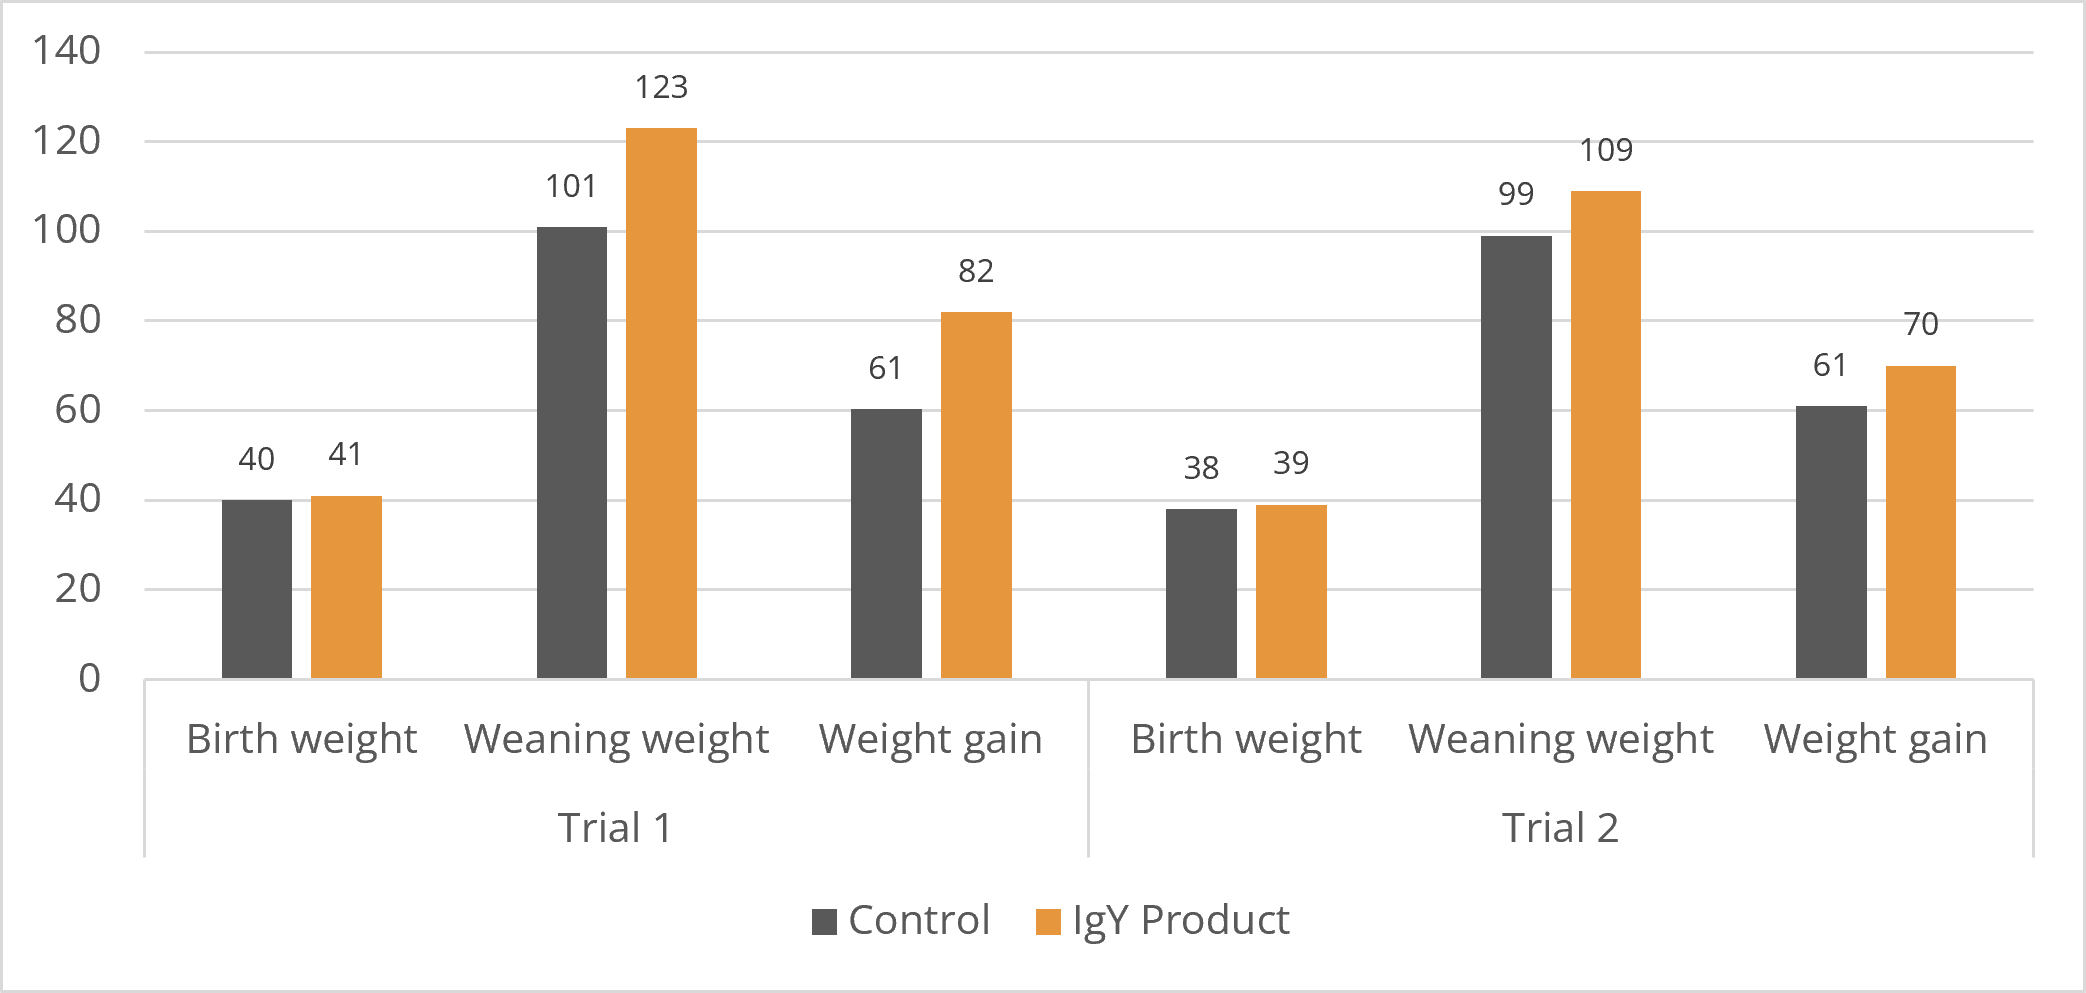
Two trials were conducted in Germany to evaluate the effect of an IgY-containing product (Globigen Life Start) on the weight development of calves. In both trials, the trial group was fed 4 g of Globigen Life Start/animal per day, in trial 1 on days 2 to 30 and in trial 2 from day 2 until weaning.
Results:
The trial results are presented in Figure 4.
FigureFigure 4: Weight development in calves with and without IgY Product
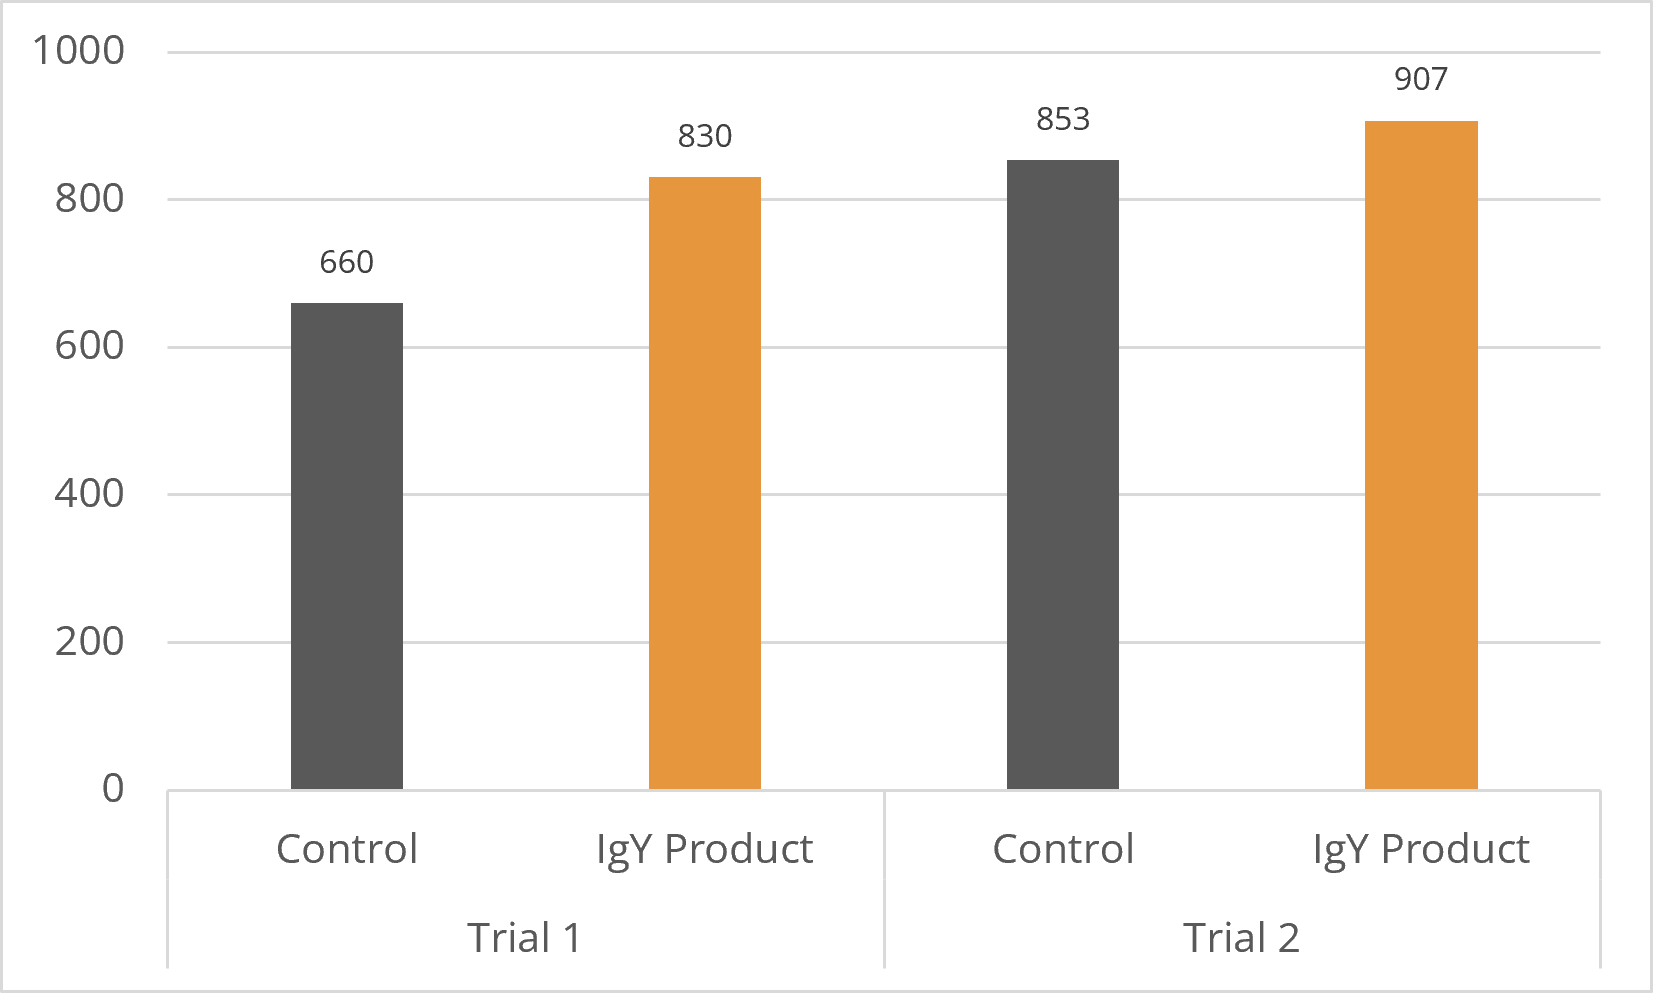
The IgY groups finished the trial with weaning weights more than 20 kg (trial 1) and 10 kg (trial 2) higher than their respective control groups, resulting in 9 kg and 21 kg higher weight gains, respectively. Daily gain is shown in Figure 5.
Figure 5: Daily gain with and without Globigen Life Start
Egg immunoglobulins improve animal health, welfare, and performance
Egg immunoglobulins support young animals such as calves during their first weeks of life by binding pathogens in the intestine. Reducing the pathogenic pressure has two positive consequences:
Decreased occurrence of diarrhea and
Fewer competitors for nutrients
The result, as shown in several trials, is fewer medical treatments, improved livability, and better performance, thereby reducing antibiotic use in calf rearing.
References:
Erhard, M.H., J. Kellner, J. Eichelberger, and U. Lösch. “Neue Möglichkeiten in Der Oralen Immunprophylaxe Der Neugeborenendiarrhoe Des Kalbes- Ein Feldversuch Mit Spezifischen Eiantikörpern.” Berl Münch Tierärztl Wochenschr 106 (1993): 383–87.
Ikemori, Yutaka, Masahiko Kuroki, Robert C. Peralta, Hideaki Yokoyama, and Yoshikatsu Kodama. “Protection of Neonatal Calves against Fatal Enteric Colibacillosis by Administration of Egg Yolk Powder from Hens Immunized with K99-Piliated Enterotoxigenic Escherichia Coli.” American Journal of Veterinary Research 53, no. 11 (November 1, 1992): 2005–8. https://doi.org/10.2460/ajvr.1992.53.11.2005.
Ikemori, Yutaka, Masahiko Kuroki, Robert C. Peralta, Hideaki Yokoyama, and Yoshikatsu Kodama. “Protection of Neonatal Calves against Fatal Enteric Colibacillosis by Administration of Egg Yolk Powder from Hens Immunized with K99-Piliated Enterotoxigenic Escherichia Coli.” American Journal of Veterinary Research 53, no. 11 (November 1, 1992): 2005–8. https://doi.org/10.2460/ajvr.1992.53.11.2005.
Kellner, J., M.H. Erhard, M. Renner, and U. Lösch. “Therapeutischer Einsatz Von Spezifischen Eiantikörpern Bei Saugferkeldurchfall – Ein Feldversuch.” Tierärztliche Umschau 49, no. 1 (January 1994): 31–34.
Klemperer, Felix. “Ueber Natürliche Immunität Und Ihre Verwerthung Für Die Immunisirungstherapie.” Archiv für Experimentelle Pathologie und Pharmakologie 31, no. 4–5 (June 1893): 356–82. https://doi.org/10.1007/bf01832882.
Kuroki, M. “Oral Passive Immunization Using Chicken Egg Yolk Immunoglobulins against Bovine Rotavirus and Coronavirus Infections.” Recent Res. Devel. Virol. 1 (1999): 95–106.
Kuroki, Masahiko, Yutaka Ikemori, Hideaki Yokoyama, Robert C. Peralta, Faustino C. Icatlo, and Yoshikatsu Kodama. “Passive Protection against Bovine Rotavirus-Induced Diarrhea in Murine Model by Specific Immunoglobulins from Chicken Egg Yolk.” Veterinary Microbiology 37, no. 1–2 (October 1993): 135–46. https://doi.org/10.1016/0378-1135(93)90188-d.
McMorran, Elizabeth Kay. “Bundesweite Untersuchung Zur Kolostralen Versorgung von Neugeborenen Kälbern von Elizabeth Kay McMorran.” Bundesweite Untersuchung Zur Kolostralen Versorgung von Neugeborenen Kälbern von Elizabeth Kay McMorran. Dissertation, LMU, 2006.
Stemme, K., E. Rauch, N. Franz, S. Reese, and M. Erhard. “11. Berlin-Brandenburgischer Rindertag.” In Das Gesunde Kalb – Eine Deutschlandweite Erhebung Zur Kolostralversorgung Neugeborener Kälber, 41–42. Berlin: Cuvillier, n.d.
Stemme, K., M. Erhard, D. Klaus-Halla, S. Reese, and E. Rauch. “DVG-Vet-Congress – Fachgruppenübergreifende Buiatrik-Tagung,” 49–53. Berlin: DVG e.V., 2022.
Yokoyama, H, R C Peralta, R Diaz, S Sendo, Y Ikemori, and Y Kodama. “Passive Protective Effect of Chicken Egg Yolk Immunoglobulins against Experimental Enterotoxigenic Escherichia Coli Infection in Neonatal Piglets.” Infection and Immunity 60, no. 3 (March 1992): 998–1007. https://doi.org/10.1128/iai.60.3.998-1007.1992.
Yokoyama, Hideaki, Robert C. Peralta, Kouji Umeda, Tomomi Hashi, Faustino C. Icatlo, Masahiko Kuroki, Yutaka Ikemori, and Yoshikatsu Kodama. “Prevention of Fatal Salmonellosis in Neonatal Calves, Using Orally Administered Chicken Egg Yolk Salmonella-Specific Antibodies.” American Journal of Veterinary Research 59, no. 4 (April 1, 1998): 416–20. https://doi.org/10.2460/ajvr.1998.59.04.416.
Yokoyama, Hideaki, Robert C. Peralta, Sadako Sendo, Yutaka Ikemori, and Yoshikatsu Kodama. “Detection of Passage and Absorption of Chicken Egg Yolk Immunoglobulins in the Gastrointestinal Tract of Pigs by Use of Enzyme-Linked Immunosorbent Assay and Fluorescent Antibody Testing.” American Journal of Veterinary Research 54, no. 6 (June 1, 1993): 867–72. https://doi.org/10.2460/ajvr.1993.54.06.867.
Methane must be reduced – What about rumen performance?
Authors: Valentina Mayorga, Predrag Persak, and Inge Heinzl, EW Nutrition
Every day, dairy cows convert large amounts of feed into milk, but part of that valuable energy is inevitably lost in the form of methane produced during rumen fermentation. This gas not only represents a metabolic inefficiency for the animal but has also become one of the most discussed environmental impacts. Some organizations, such as the Institute for European Environmental Policy (IEEP), state that livestock production in the European Union accounts for approximately 65% of agricultural greenhouse gas (GHG) emissions (Hart et al., 2025). A very high number! As sustainability requirements and pressure from policymakers, processors, and consumers intensify, the dairy industry faces a critical challenge: reducing methane emissions while maintaining rumen health, fermentation efficiency, and productive performance.
Can feed additives master this difficult task?
In response to this challenge, a variety of feed additives and nutritional strategies have been developed to mitigate methane emissions in ruminants. However, methane mitigation must be approached carefully. Some products aim to suppress specific microbial pathways involved in methane formation, potentially altering rumen fermentation dynamics if not properly balanced.
One of the key mechanisms involved in methane mitigation is the redirection of hydrogen within the rumen. During ruminal fermentation, hydrogen produced by microbial activity can follow different metabolic pathways:
1. Traditionally, a significant portion of this hydrogen is utilized by methanogenic archaea to produce methane
2. However, hydrogen can also be incorporated into alternative pathways, particularly the formation of propionate. When rumen fermentation shifts toward propionate production, less hydrogen becomes available for methanogenesis, resulting in lower methane emissions. This process, often referred to as hydrogen redirection, enables methane reduction without suppressing overall microbial fermentation.
Among the nutritional approaches explored, plant-derived compounds, such as essential oils, have gained increasing attention for their ability to modulate rumen microbial populations. With essential oils, it is possible to influence specific groups of microorganisms involved in rumen fermentation, but also in methane production.
Many methanogens, e.g., are closely associated with rumen protozoa; therefore, reducing protozoal populations may indirectly decrease methane formation while maintaining normal fermentation processes.
Activo Premium trial gives reason for hope
Activo Premium, a blend of carefully selected essential oils, has been evaluated for its effects on rumen fermentation and methane production under controlled experimental conditions.
Trial Design:
Ingredients
g/kg DM
Chopped Tifton hay
500
Ground maize
325
Soybean meal
172
Chemical composition
% in DM
Organic matter
91.8
Crude protein
13.2
Neutral detergent fiber
59.4
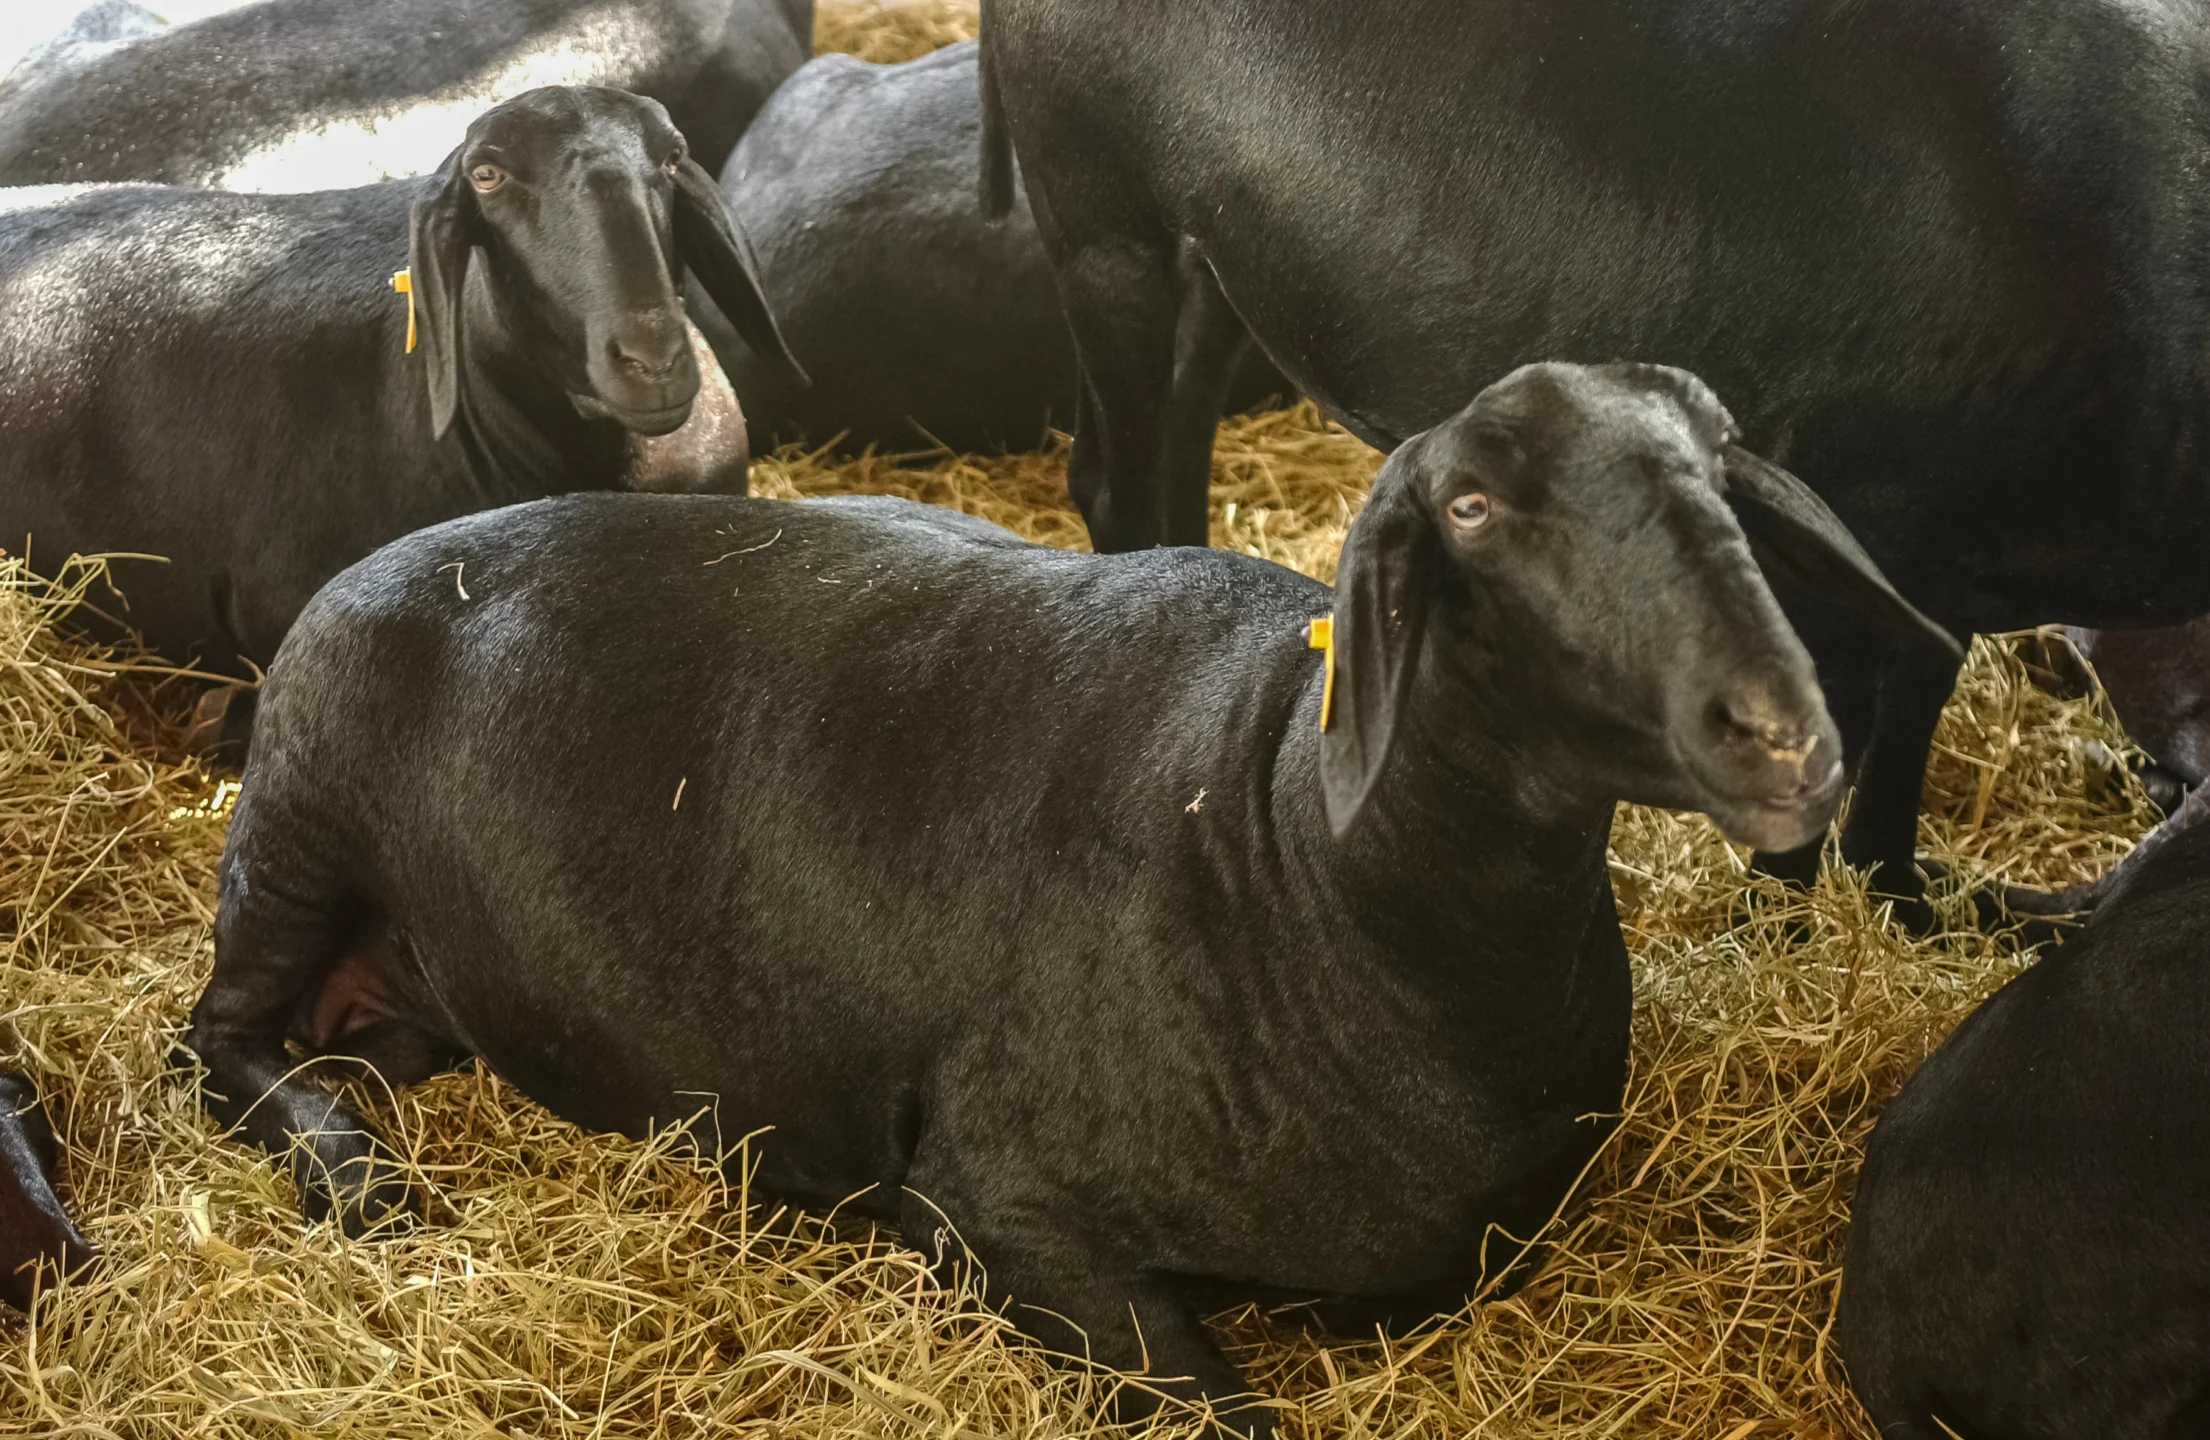
The study was conducted at the CENA (University of São Paulo). Nine rumen-cannulated Santa Inês sheep (55 ± 3.7 kg of BW) were divided into three groups and randomly distributed in a 3×3 Latin square design for three consecutive periods of 37 days each.
At the beginning of each trial period, all sheep were fed ad libitum a basal diet without additives for 15 days. After this period, the animals were distributed to three different groups:
Group 1: Control (basal diet without additives) Group 2: Basal diet with 200 mg product/kg DM Group 3: Basal diet with 400 mg product/kg DM.
The sheep were fed experimental diets twice daily in equal portions and had free access to fresh water.
Results:
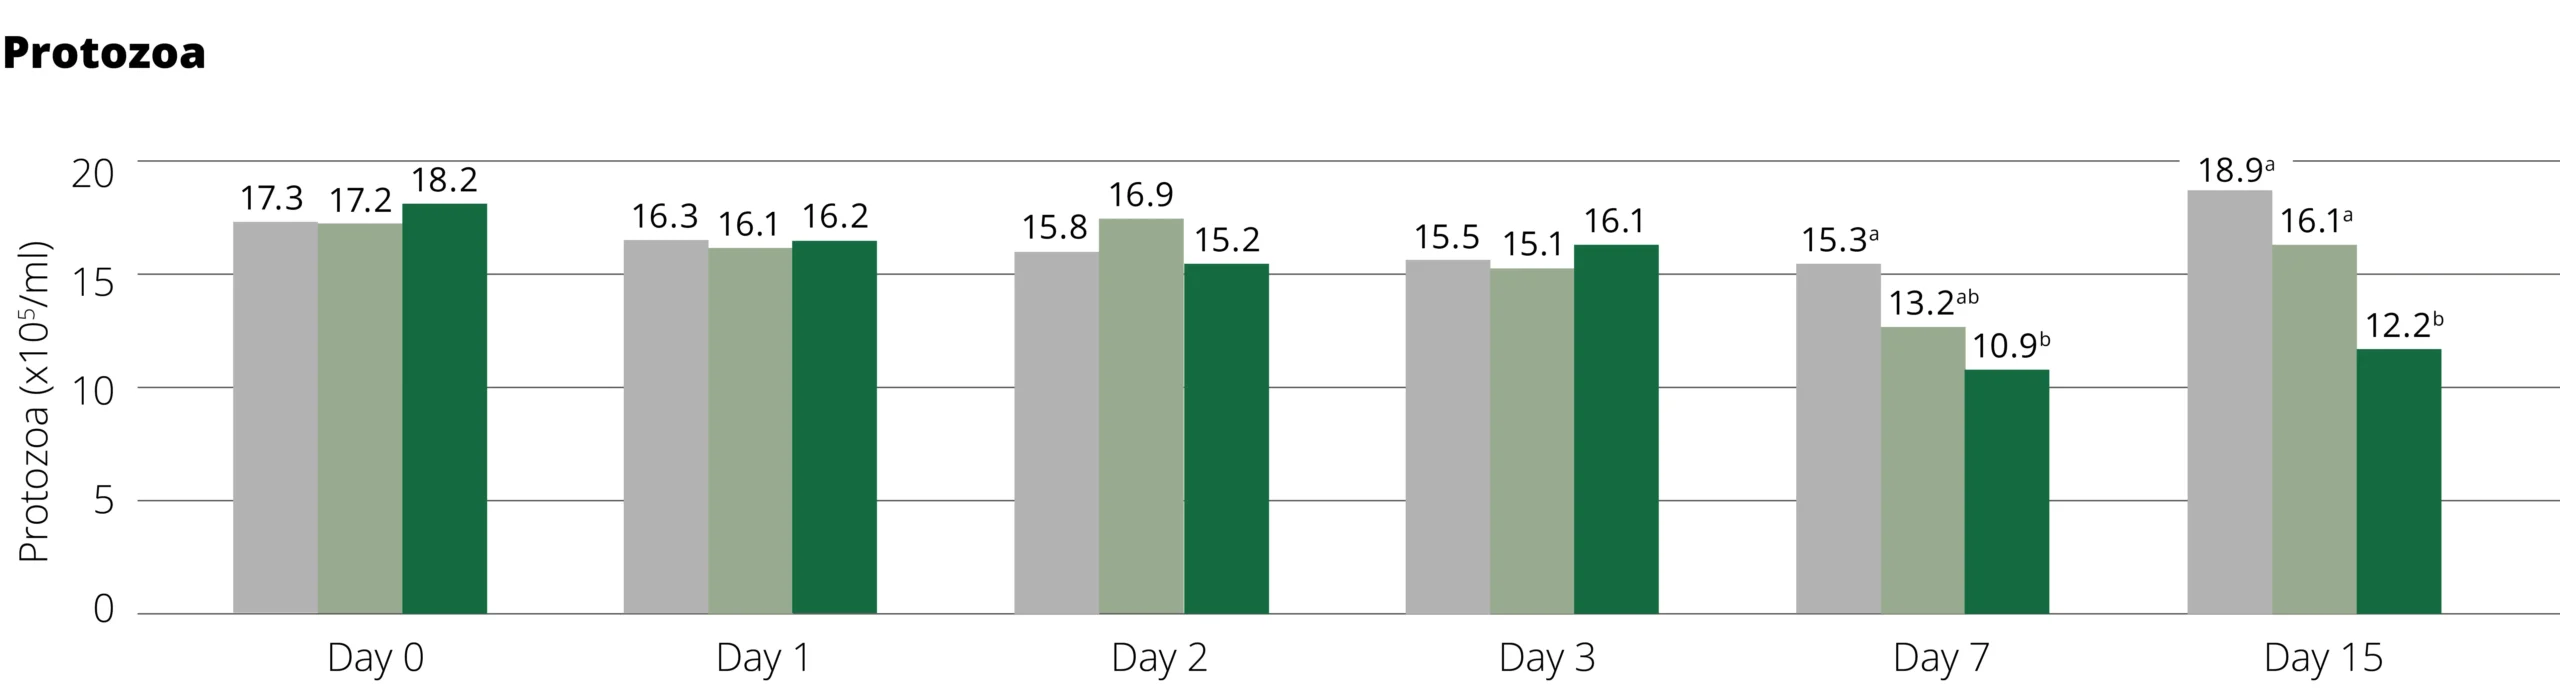
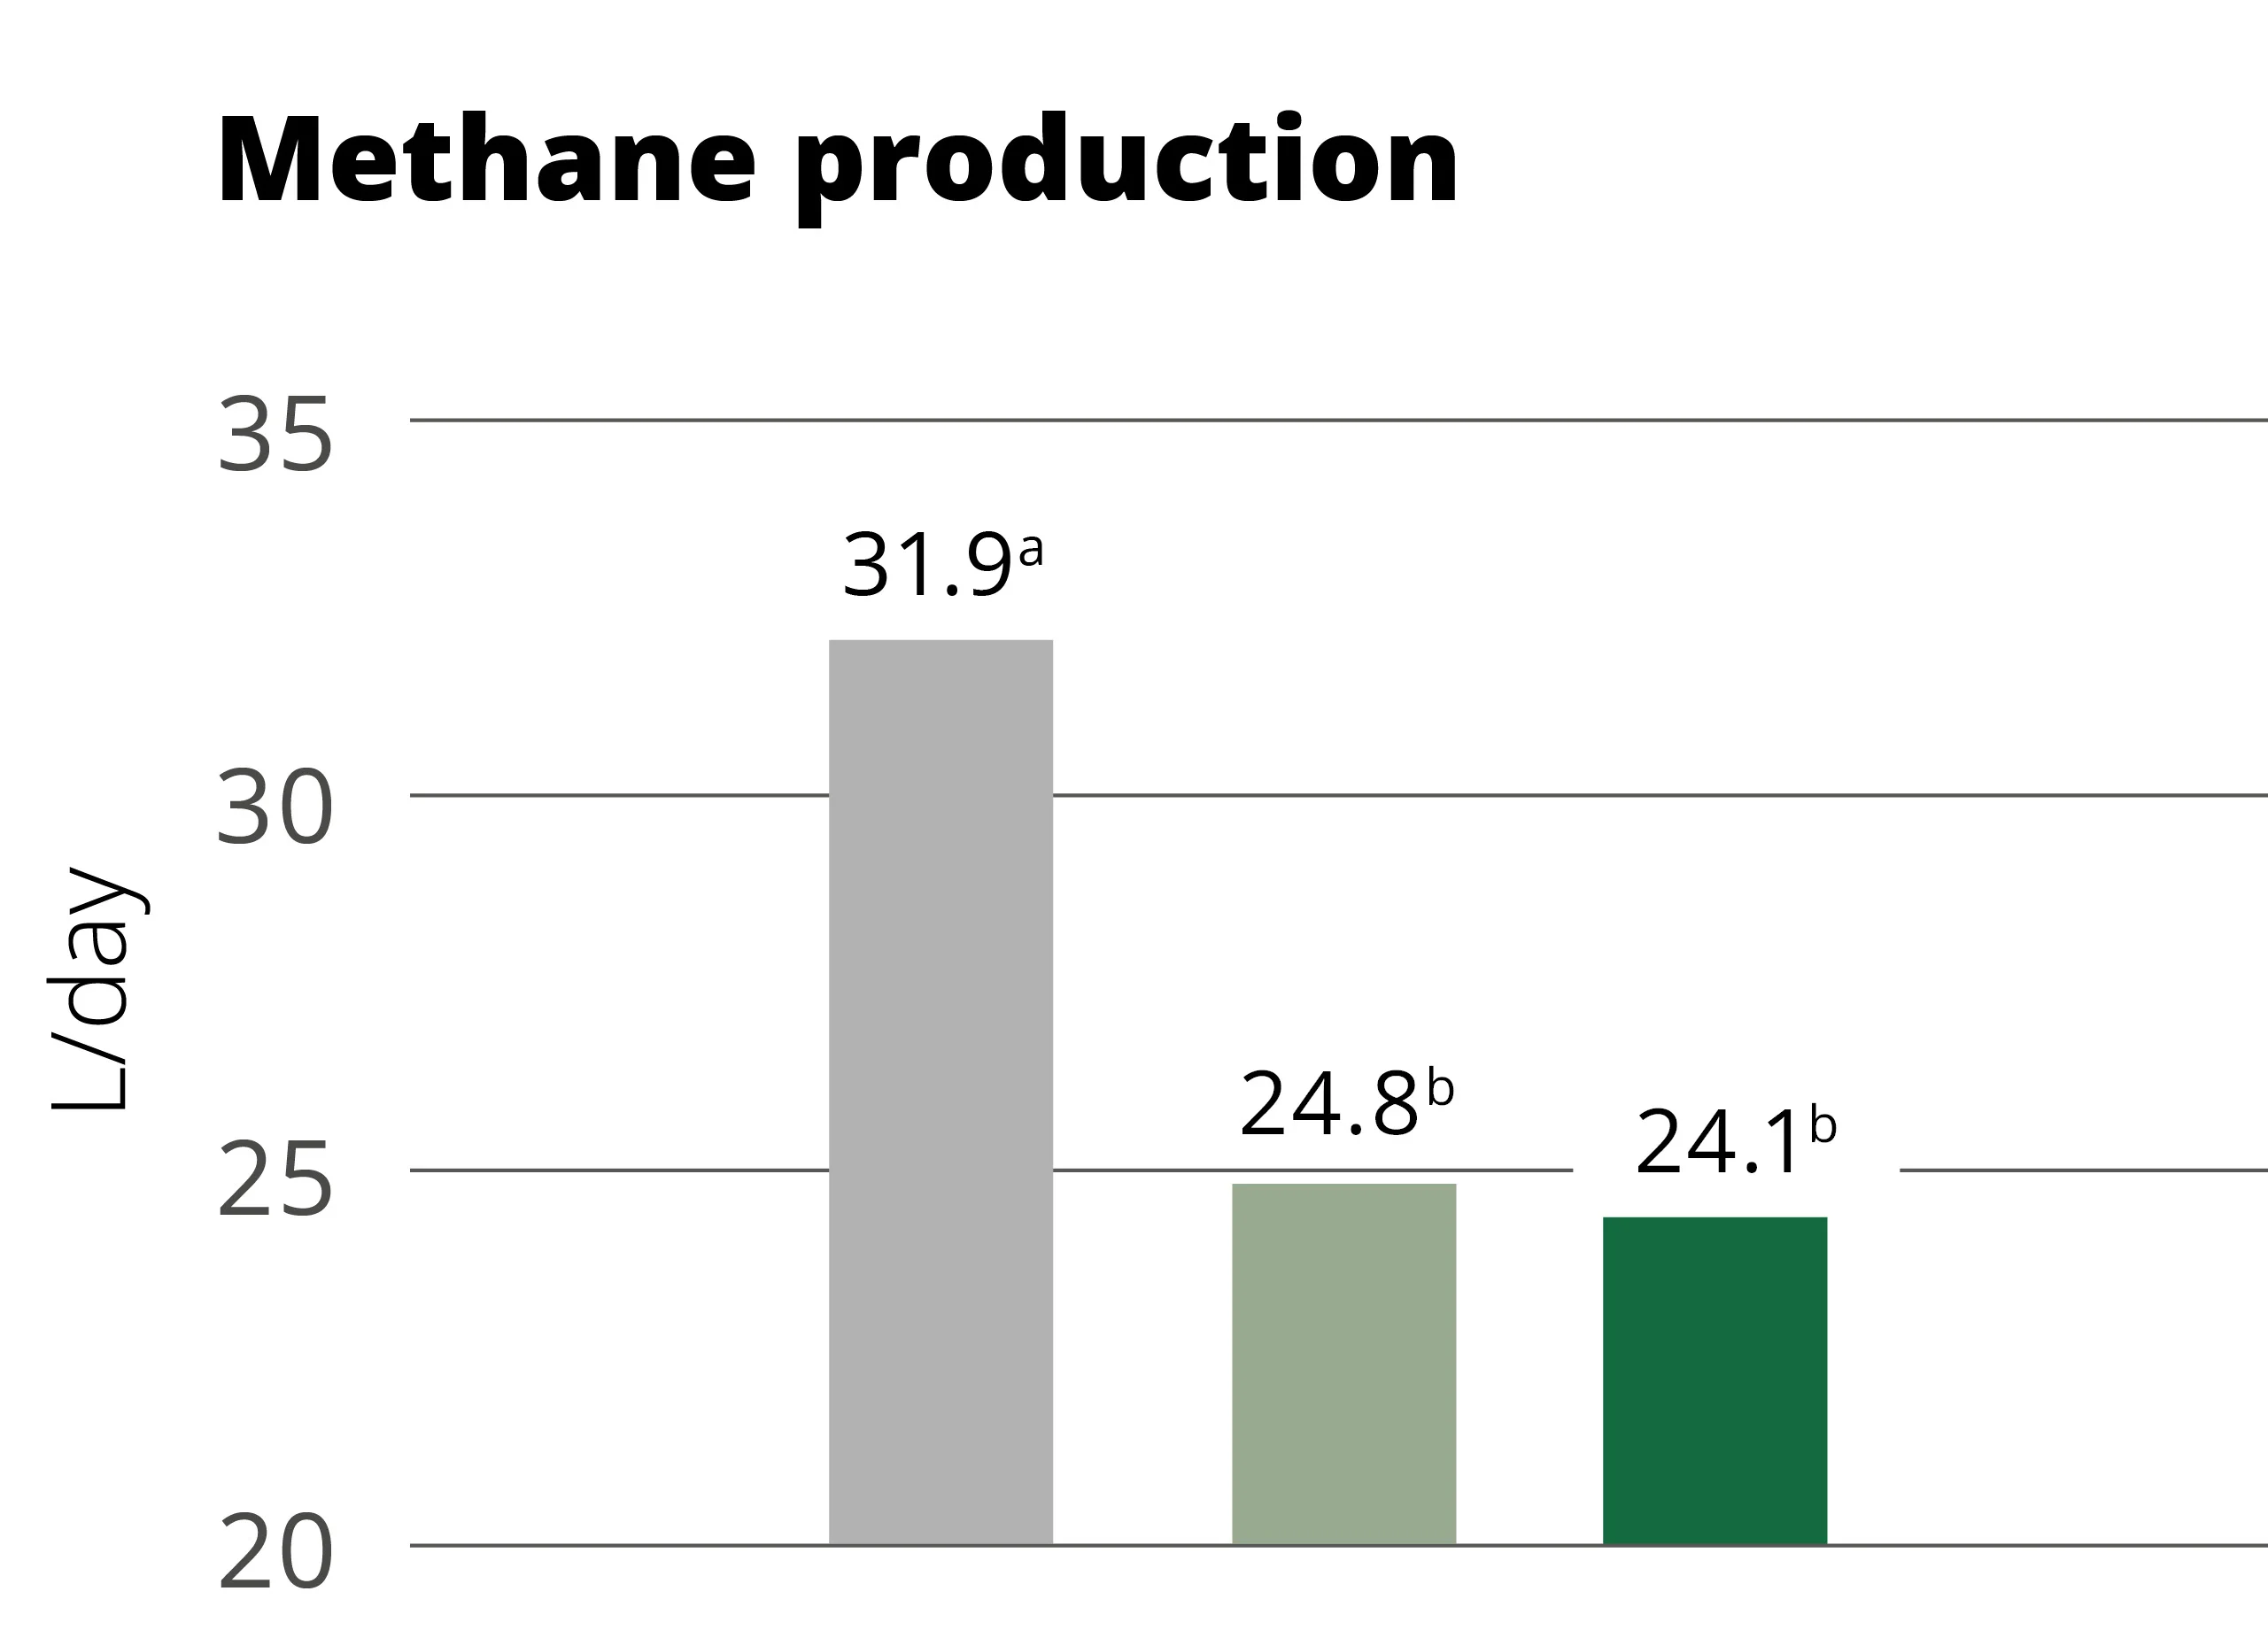
Experimental results showed a significant reduction in protozoa from day 7 after the first application and in methane production.
Figure 1: Decreasing levels of protozoa with increasing dosage of Activo Premium
Figure 2: Decreasing methane production due to the application of Activo Premium
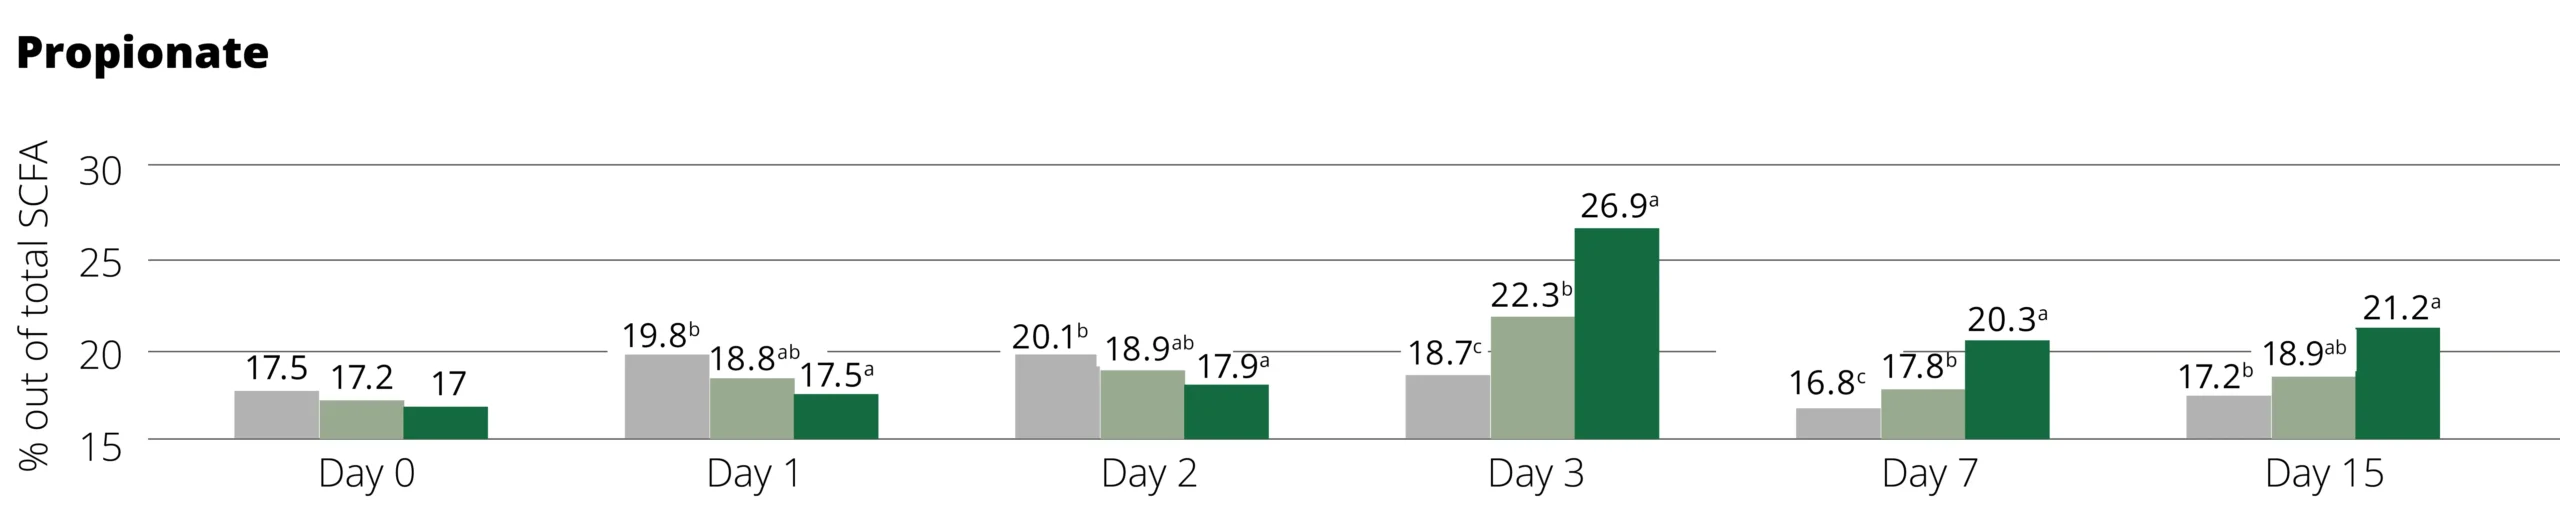
Furthermore, propionate levels increased. The shift in SCFA towards propionic acid indicates that hydrogen, which methanogenic bacteria would have otherwise used for methane production, can now be used by rumen bacteria to produce bacterial protein, which then can serve as a nutrient for the sheep.
Figure 3: Shift of SCFA towards propionate with increasing dosage of Activo Premium
Phytomolecules are an optimal tool for methane reduction
Reducing greenhouse gas emissions has become a global responsibility to protect the future of our planet. Among agricultural sources, methane production from ruminants is considered one of the major contributors to greenhouse gas emissions. Therefore, effective nutritional strategies are increasingly important for sustainable livestock production. Phytomolecules-based products, such as Activo Premium, represent a promising approach to reducing methane formation by modulating rumen fermentation while maintaining animal productivity. This offers benefits for both farmers and the environment.
Rapetti, L., & Colombini, S. (n.d.). Evaluation of the effects of a blend of essential oils (named ACTIVO PREMIUM) on in vivo rumen microbiota and in vitro fermentation profile: Final report of the experimental trial. Università degli Studi di Milano, Department of Agricultural and Environmental Sciences.
Shifting Consumer Preferences in Dairy: The Higher Demand for High-Protein Milk in the GLP-1 Era
Author: Valentina Mayorga and Inge Heinzl, EW Nutrition
Today, the dairy market is undergoing a remarkable transformation. Demand is no longer focused solely on volume or fat content, but rather on a specific component: protein. But why is protein suddenly at the center of consumer attention? Recent estimates indicate that approximately one in eight adults (12%) in the United States is currently using a GLP-1 medication such as Ozempic or Wegovy for weight loss or chronic disease management (Lacsamana, 2025). By significantly reducing appetite and overall caloric intake, these medications may increase the risk of muscle mass loss in the absence of adequate nutritional planning, particularly when protein intake is insufficient.
Humans and animals compete for high-protein products
For this reason, consumers are increasingly seeking high-quality protein sources, particularly those rich in whey protein, known for its high biological value and rapid digestibility. However, this shift in consumer demand also creates a new challenge for the feed industry. Whey protein, traditionally used by feed mills as a highly digestible ingredient for young animals, is increasingly being diverted to human nutrition markets, creating direct competition for this valuable protein source. Either way, dairy consumption is growing, but not uniformly across all categories. The increase is concentrated in products with lower fat content and higher protein density, such as cottage cheese, premium Greek yogurt, and whey-protein-enriched milk beverages. The protein market is accelerating, and in an industry that rewards adaptation, standing still is simply another way of moving backward.
This shift in what consumers care about raises a key question for dairy farmers: how can they increase milk protein content through farm nutrition practices? Improving milk protein content isn’t just about putting more protein into the diet. It needs a balanced nutritional approach that supports rumen function, promotes microbial protein synthesis, and maintains overall metabolic function. With the right feed mix, farms can better meet consumers’ changing tastes.
Increase milk protein with higher energy intake
Milk protein synthesis is primarily driven by energy intake, particularly fermentable energy. When cows consume more metabolizable energy (ME), rumen microbial activity increases, leading to greater microbial protein synthesis. Since microbial protein represents the main source of metabolizable amino acids absorbed in the small intestine, improving rumen efficiency directly supports higher milk protein production. Research has shown that increasing concentrate intake is associated with increases in milk protein concentration, with a response of approximately +0.06 percentage units per additional 10 MJ of ME intake per day. This response occurs because higher energy intake increases dry matter intake, improves nitrogen utilization, enhances microbial growth, and ultimately increases the supply of metabolizable protein to the mammary gland. Importantly, the source of energy matters. Energy derived from fermentable carbohydrates, particularly starch and sugars, is far more effective at stimulating microbial protein synthesis than energy derived from fat.
Starch plays a crucial role
Among fermentable carbohydrates, starch plays a central role in increasing milk protein concentration. When starch in the diet increases, rumen fermentation produces more propionate. Propionate is absorbed and converted in the liver into glucose through gluconeogenesis. Glucose is essential for lactose synthesis in the mammary gland, and lactose regulates milk volume through osmotic pressure. At the same time, improved energy status enhances microbial protein synthesis, increasing the availability of amino acids for casein production. This makes increasing dietary starch one of the most influential nutritional strategies for enhancing milk protein concentration.
Replacing grass silage with forages higher in starch and sugars, such as maize silage or fodder beet, can increase total energy intake, milk yield, and milk protein concentration. However, starch must be carefully balanced with adequate fiber. Excessively low fiber levels can reduce rumen pH, leading to acidosis, decreased feed intake, milk fat depression, and compromised animal health. Therefore, the objective is not simply high starch inclusion but rather high fermentable energy within a stable rumen environment, supported by sufficient physically effective fiber.
Effective protein strategies coordinate the supply of fermentable energy and degradable protein
Feeding more crude protein alone does not increase milk protein concentration. If degradable protein exceeds the availability of fermentable energy, excess nitrogen is converted into urea, reducing nitrogen efficiency and increasing milk urea nitrogen (MUN) without improving milk protein yield. Instead, effective protein strategies involve synchronizing rumen-degradable protein (RDP) with fermentable carbohydrates to maximize microbial growth, while also providing adequate rumen-undegradable protein (RUP) to supply metabolizable amino acids directly to the intestine. Precision supplementation of limiting amino acids, particularly methionine between 2.4-2.5% and lysine between 7.2-7.5% of metabolizable protein (MP), ensures a crucial 3:1 ratio, supporting casein synthesis in the mammary gland and improving true milk protein yield.
Feeding is one thing, genetics is another
Under optimized nutritional management, realistic improvements in milk protein concentration can be achieved. In Holstein cows, which typically average around 3.1% protein, levels can increase to approximately 3.3–3.5%. In Jersey cows, which average around 3.9%, protein concentration may increase to approximately 4.1–4.3% with well-balanced diets and excellent management. Increases beyond these ranges generally require genetic selection in addition to nutritional adjustments.
Higher protein production is possible…up to a certain degree
High-starch diets often increase milk protein while potentially lowering milk fat percentage. This occurs because increased propionate production is associated with reduced acetate formation, and acetate is the primary precursor for milk fat synthesis. For consumers seeking dairy products with higher protein and lower fat content (particularly individuals aiming to preserve muscle mass while reducing caloric intake), this shift in milk composition may align with emerging market demands. However, excessive starch without adequate fiber can negatively impact rumen health, emphasizing the importance of nutritional balance.
References
Chamberlain, A. T., and J. M. Wilkinson. Feeding the dairy cow. Mountwood House: Chalcombe Publications, 2011.
EU Agricultural Outlook 2024-2035: Projected Trends and Challenges
by Ilinca Anghelescu, Global Director Marketing & Communications, EW Nutrition
The European Union (EU) agricultural sector is confronted with challenges and uncertainties stemming from the geopolitical risks, extreme weather events, and evolving market demand. The EU Agricultural Outlook 2024-2035, published last month, highlights the anticipated trends, challenges, and opportunities facing the sector over the medium term, given several considerations likely shaping the future.
Initial considerations for EU agricultural trends
Macroeconomic context
The EU’s real GDP growth is expected to stabilize, contributing to a stable economic environment for agriculture. Inflation rates are projected to return to the European Central Bank’s target of 2% by 2025. Exchange rates will see the Euro slightly appreciating against the US dollar, and Brent crude oil prices are anticipated to stabilize in real terms at approximately $102 per barrel by 2035.
However, despite optimistic declarations in the recent past, we have not solved world hunger. Population growth in lower-income parts of the world is leading to an unequal distribution and, after an initial dip, the number of people going to bed hungry is expected to rise again. Moreover, in the next ten years some improvements are foreseen but no massive changes are expected in the percentage of food groups and calories available per capita.
Climate change impact
Climate change is reshaping EU agriculture by affecting critical natural resources such as water and soil. Agroclimatic zones are shifting northwards, with implications for crop cultivation patterns. For example, regions traditionally suitable for wheat may increasingly shift focus to other crops better adapted to new climate conditions.
Consumer demand
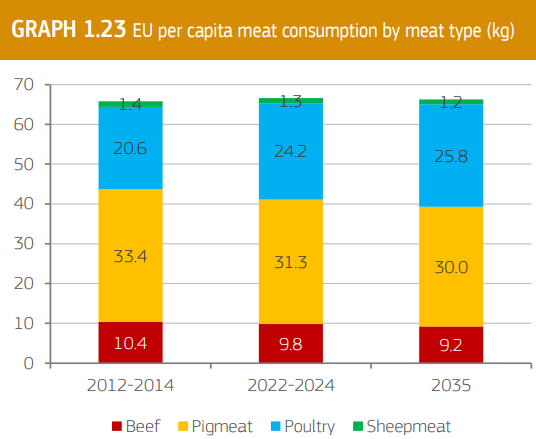
Consumer awareness of sustainability is driving significant shifts in dietary preferences in the EU. The demand for plant proteins like pulses is increasing, while meat consumption, particularly beef and pork, is declining due to environmental and health concerns. Conversely, demand for fortified and functional dairy products is on the rise.
What are the projected agricultural trends in 2024-2035?
Arable crops
Land use: While the total agricultural land in the EU remains stable, a shift in crop focus is anticipated. Land allocated for cereals and rapeseed is expected to decline, making way for soya beans and pulses due to reduced feed demand and policy incentives for plant proteins.
Cereals: Production of cereals, including wheat, maize, and barley, is forecast to stabilize with minor yield increases due to advancements in precision farming and digitalization. Wheat production is set to recover after an expected dip in 2024.
Dairy Sector
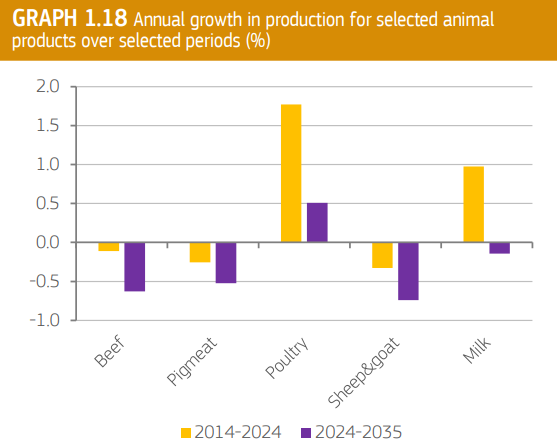
Milk production: Although milk yields are projected to increase due to improved genetics and farming practices, the decline in the dairy cow herd will result in a slight overall reduction in milk production by 2035.
Dairy products: The production of cheese and whey will grow steadily, driven by domestic and international demand. Conversely, the consumption of drinking milk is expected to decline, while demand for fortified and functional dairy products grows.
Meat Sector
Beef and veal: Beef production is expected to decrease by 10%, with the EU cow herd shrinking by 3.2 million head by 2035. This decline is attributed to sustainability concerns, high production costs, and changing consumer preferences. Beef consumption is also projected to decline, driven by high prices and a preference for plant-based alternatives.
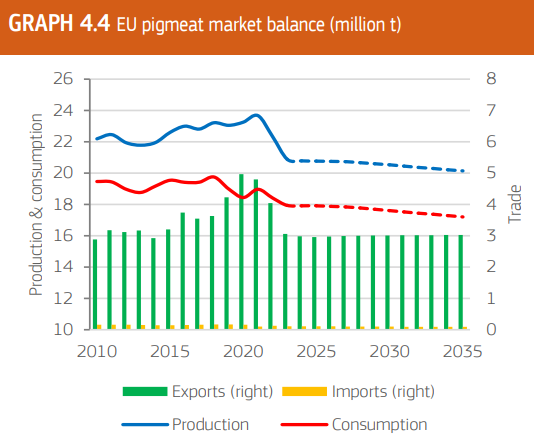
Pig meat: The sector faces a projected annual production decline of 0.9%, equating to a reduction of nearly 2 million tons compared to 2021-2023 levels. This trend is largely influenced by concerns over sustainability and a declining preference for fatty meats.
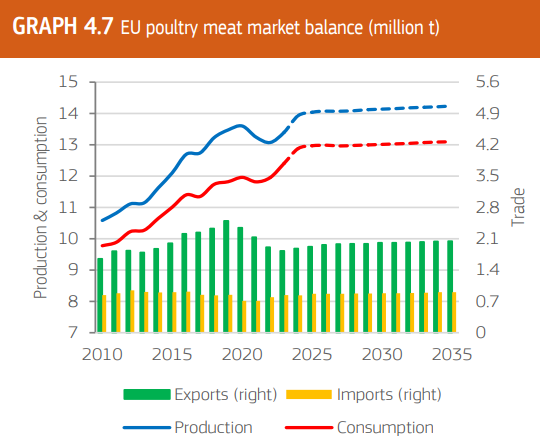
Poultry: In contrast, poultry production is forecast to increase due to its healthier image, lower cost, and minimal cultural or religious constraints. However, the growth rate will be slower than in the previous decade.
Upcoming challenges in agriculture
Climate Resilience
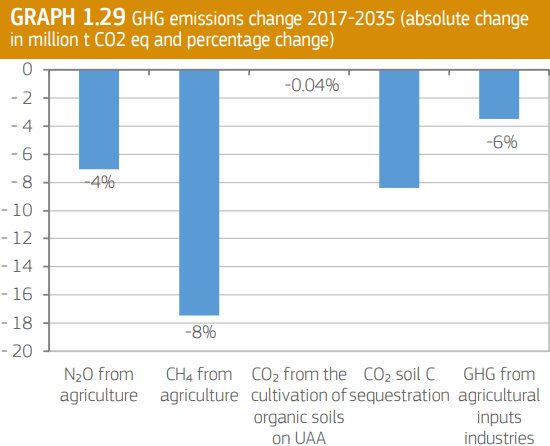
The increasing frequency of extreme weather events requires investments in resilient farming practices. Adoption of precision farming and crop diversification is critical to mitigate climate impacts. However, if existing policies are further implemented, greenhouse gas emissions are expected to see a significant decline.
Policy Frameworks
The Common Agricultural Policy (CAP) plays a pivotal role in steering the sector toward sustainability. However, farmers face challenges in adapting to stricter environmental regulations and securing sufficient funding for transitions. The recent Mercosur agreement has already stirred dissent in EU countries that fear unfettered competition without similar policy regulations.
Market Dynamics
Global trade tensions and competition in agricultural markets pose significant risks. While the EU remains a net exporter, dependence on imports for certain crops, such as soya beans, highlights vulnerabilities in supply chains.
In a weather-shock scenario for the EU feed supply chain, the report highlights that increased feed prices would drive up retail meat prices by 10% for poultry and pork producers, and 5% for beef and veal producers. The increase would be less abrupt for retail prices, rising by 3% for pork, and 4% for poultry meat. Producers need to be mindful of the absorbed costs of these potential shocks.
Conclusion
The EU agricultural sector must continue to balance productivity, sustainability, and consumer preferences. While advancements in technology and policy frameworks offer pathways to resilience, addressing challenges such as climate change and market dynamics will be critical to achieving long-term goals.
BioStabil Plus improves grass silage quality and cattle profitability
by Dr. Vesna Jenkins, Global Product Manager, EW Animal Care
Making silage enables the farmer to store forage, providing a cost-effective feed when required. From silage making through to feeding out, however, the challenge is to ensure that valuable dry matter, energy and protein are not lost. Any losses would require supplementation from other sources at extra cost. In the case of protein, farmers would need to purchase additional soybean meal, for example, to maintain cow productivity.
Clostridia: The Main Villain
One of the greatest challenges to making good silage is the presence of Clostridia bacteria, which can negatively impact animal health, performance and profitability. These bacteria pose a health risk to both beef and dairy cattle and can negatively influence cheese quality through the late blowing defect.
During the ensiling process, Clostridia break down protein, reducing silage nutritional value, and produce butyric acid, which decreases silage palatability and affects feed intake. Clostridia can easily enter through soil contamination and thrive in forage with low dry matter, high buffering capacity, or lower levels of soluble carbohydrates and nitrate.
Negative impacts of Clostridia
Health risk to cattle
Reduced nutritional value of silage
Declined feed intake, leading to diminished productivity
Late blowing defect in cheese
Trial results
A recent scientific trial by the Swedish University of Agricultural Sciences (SLU) tested the effect ofBioStabil Plus silage inoculant on difficult to ensile grass-clover forage (28% DM) challenged with Clostridia. The research demonstrated a clear effect of BioStabil Plus on multiple parameters.
The application of BioStabil Plus to glass-clover forage resulted in:
Improved dry matter (DM) retention (Figure 1)
Enhanced protein preservation (Figure 2)
Both outcomes contribute to feed cost savings.
Figure 1. Significantly lower dry matter loss in grass-clover silage treated with BioStabil Plus (90 days past ensiling, P<0.001). Source: Swedish University of Agricultural Sciences and EW Nutrition.
Figure 2. Less ammonia-N with BioStabil Plus, significantly higher protein preservation (90 days past ensiling, P<0.001). Source: Swedish University of Agricultural Sciences and EW Nutrition.
Benefits of BioStabil Plus
Protection Against Nutrient Loss – BioStabil Plus protects against dry matter, energy, and protein losses in the fermentation period. It contains the rapid-growing lactic-acid-producing homofermentative strain L. plantarum DSM 19457, ensuring sufficient lactic acid production for a rapid pH drop in ensiled forage (Figure 3).
Figure 3. Lower pH in grass-clover silage challenged with Clostridia and treated with BioStabil Plus compared to Clostridia challenged forage without inoculant (90 days past ensiling, P<0.001). Source: Swedish University of Agricultural Sciences and EW Nutrition.
Reduction of Clostridial Load – BioStabil Plus reduces the Clostridial load as evidenced by significantly lower butyric acid production (Figure 4). Lower butyric acid content maintains silage palatability, feed intake, and avoids final dairy product quality issues.
Figure 4. Significantly lower butyric acid with BioStabil Plus showing minimal Clostridia presence (90 days past ensiling, P<0.001). Source: Swedish University of Agricultural Sciences and EW Nutrition.
Enhanced Aerobic Stability – BioStabil Plus contains heterofermentative strains L. buchneri DSM 19455 and L. brevis DSM 23231, producing an optimal level of acetic acid for enhanced aerobic stability during the feed-out phase. An EFSA scientific opinion on L. brevis DSM 23231 specifically outlines its ability to reduce Clostridia risk.
Producing high-quality, palatable, well-preserved silage ensures that the investment in silage making is not wasted. Most importantly, the preserved energy and protein maximize profitability through higher production of milk or meat and generate feed cost savings that support producers’ margins.
Contact your local EW Nutrition representative to access valuable resources and advice on all aspects of optimized silage management.
Antimicrobial resistance in animal production workers, a serious challenge
With 73% of human-use antibiotics also used in food-animal production, antimicrobial resistance (AMR) is a pressing global health concern, particularly in contexts where humans and animals are in close proximity, such as in animal production facilities. This issue is exacerbated by the widespread use of antibiotics in livestock farming, which not only promotes resistance in bacteria but also poses direct risks to farm workers.
Antimicrobial resistance in farm workers in Denmark
In Denmark, a country renowned for its robust agricultural monitoring systems, significant strides have been made in tracking AMR. A comprehensive report from 2015 emphasized the occurrence of antimicrobial-resistant bacteria, particularly in livestock-associated methicillin-resistant Staphylococcus aureus (LA-MRSA). The Danish Integrated Antimicrobial Resistance Monitoring and Research Program (DANMAP) highlighted that farm workers frequently came into contact with these resistant pathogens, which posed occupational hazards and public health challenges (Bager et al., 2015). The program found that 88% of pigs carried LA-MRSA, and farm workers had significantly elevated exposure risks, particularly in intensive swine operations (DANMAP 2015 Report).
Antimicrobial resistance in farm workers in the US
Studies in the United States have revealed even more alarming statistics. Farm workers in intensive animal farming environments were found to be 32 times more likely to develop antibiotic-resistant infections than the general population. This increased risk was attributed to prolonged exposure to resistant bacteria and antibiotic residues in animal feed and the environment (Silbergeld et al., 2008). The close interaction between humans and animals in confined spaces fosters the transfer of resistant genes, making these workers a vulnerable group.
Mechanisms of resistance spread
The spread of AMR from livestock to humans can occur through several pathways:
Direct contact: Handling animals and exposure to manure or bodily fluids.
Contaminated food: Consumption of undercooked or improperly handled meat products.
Environmental contamination: Water and soil contaminated with antibiotics or resistant bacteria.
What can be done?
Even in countries where antimicrobials reduction legislation has been in place for almost two decades, such as Germany or Sweden, new resistance cases are constantly discovered. In supermarkets around the world, meat contaminated with antibiotic-resistant superbugs is still a common occurrence. And in antibiotic resistance hot spots, “from 2000 to 2018, P50 increased from 0.15 to 0.41 in chickens—meaning that 4 of 10 antibiotics used in chickens had resistance levels higher than 50%. P50 rose from 0.13 to 0.43 in pigs and plateaued between 0.12 and 0.23 in cattle” (Dall, 2019). These hot spots are spread across the globe, from south and northeast India, northeast China, north Pakistan, Iran, and Turkey, to the south coast of Brazil, Egypt, the Red River Delta in Vietnam, and areas surrounding Mexico City, Johannesburg, and more recently Kenya and Morocco.
Globally, antimicrobial use in animals is projected to increase by 67% by 2030, especially in low- and middle-income countries where regulatory frameworks are weaker. Denmark provides a successful model for mitigating these risks. Policies such as the “Yellow Card” scheme have reduced antibiotic use in pigs by promoting alternative husbandry practices and strict monitoring. This approach has also reduced the prevalence of resistant bacteria in animal populations, offering a replicable strategy for other nations (Alban et al., 2017).
Recommendations for mitigation
Strengthening surveillance: Programs like DANMAP should be implemented globally to monitor antibiotic usage and resistance trends in animals and humans.
Reducing antibiotic use: Phasing out non-therapeutic uses of antibiotics, particularly as growth promoters, and avoiding Critically Important Antimicrobials for Human Medicine.
Protecting workers: Providing personal protective equipment (PPE) and regular health screenings for farm workers.
Public awareness: Educating communities about the risks of AMR and promoting safe food handling practices.
The evidence from Denmark and the U.S. underscores the urgent need to address AMR in animal production settings. Protecting farm workers from AMR not only safeguards their health but also prevents the spread of resistant pathogens across the wider public.
References
Bager, F., et al. (2015). DANMAP 2014: Use of antimicrobial agents and occurrence of antimicrobial resistance in bacteria from food animals, food, and humans in Denmark. Retrieved from DANMAP Report.
Silbergeld, E. K., Graham, J., & Price, L. B. (2008). Industrial food animal production, antimicrobial resistance, and human health. Annual Review of Public Health, 29(1), 151-169.
Alban, L., et al. (2017). Assessment of the risk to public health due to use of antimicrobials in pigs—An example of pleuromutilins in Denmark. Frontiers in Veterinary Science, 4, 74. DOI.
EU publishes Short-term Outlook for Agricultural Markets (Autumn 2024)
The EU’s Short-term Outlook for Agricultural Markets (Autumn 2024) reveals significant challenges in agriculture, with adverse weather, geopolitical instability, and fluctuating trade conditions impacting production. The report identifies declining cereal and oilseed outputs, particularly for soft wheat and maize. Meanwhile, milk production is expected to remain stable despite a shrinking cow herd, and the meat sector shows mixed trends, with poultry production rising but pigmeat and beef facing structural challenges.
EU’s Short-term Outlook for Autumn 2024 highlights the following key findings collectively shaping EU agricultural markets:
Weather conditions: Severe drought in Southern and Eastern Europe and excess rainfall in Northwestern regions have reduced cereal and oilseed yields.
Energy and input costs: Inflation is stabilizing but remains high, with elevated prices for inputs like fertilizers and energy.
Geopolitical tensions: The ongoing war in Ukraine and trade disputes are disrupting supply chains and impacting exports.
Global demand: While global agricultural demand is recovering, trade flows face disruptions due to regulatory changes and volatile market conditions.
Cereals
The EU cereal production in 2024/25 is projected at 260.9 million tons, approximately 7% below the 5-year average. This marks the lowest production in the past decade, driven by unfavorable weather conditions, including excessive rain in Northwestern Europe, which impacted planting, particularly for soft wheat, and drought in Southern and Eastern regions, severely affecting maize yields. Production of soft wheat and maize is expected to decline year-on-year by 9.5% and 4%, respectively. On the other hand, barley and durum wheat production are increasing by about 6% and 3%, respectively, compared to the previous year.
EU cereal exports are projected to decline by 22% year-on-year due to reduced production and quality issues. At the same time, domestic demand remains relatively stable, with animal feed consumption holding steady as livestock production stagnates. In terms of prices, cereal prices fell throughout 2024, pressuring farmers’ cash flow, which could hinder their ability to afford inputs such as fertilizers in the coming year.
Milk and Dairy Products
The EU milk market is expected to see relatively stable supply, despite a continuously shrinking cow herd. Milk yields have increased, compensating for the herd’s decline. Milk prices are forecast to stabilize after a period of volatility in the past few years, remaining above historical averages, and input costs for farmers, such as feed and energy, are showing signs of stabilizing, allowing for a potential improvement in farmer margins.
Despite the stability in milk supply, demand for dairy products continues to show mixed trends, influenced by shifts in consumer preferences and trade dynamics. The balance of milk supply and prices could provide an opportunity for dairy farmers to recover some profitability after several challenging years.
In the dairy products sector, cheese and butter continue to dominate EU production, with butter production projected to rise slightly in 2024, driven by stable milk supplies and strong domestic demand. The demand for butter in the global market remains relatively strong, although competition is rising.
Cheese production is also expected to remain stable, reflecting a balance between domestic and export markets. The cheese sector has seen steady growth over the years, supported by increasing consumer demand for premium and specialty cheeses. The demand for skimmed milk powder (SMP) and whole milk powder (WMP) is projected to remain subdued due to fluctuating global demand, particularly from key markets such as China, although some growth is expected in non-European markets.
Meat Products
The meat sector in the EU remains a mixed picture, with structural changes and external factors shaping production and trade in 2024.
Beef and Veal: Beef production continues to face structural decline due to a shrinking herd size, with the sector stabilizing but at lower levels of production. The demand for EU beef remains relatively high, and exports are increasing, but domestic production is likely to remain constrained by environmental and economic pressures. Additionally, the number of animals has been declining consistently, reflecting longer-term trends within the EU beef industry.
Pigmeat: The EU pigmeat sector is facing diverse challenges, with some countries recovering from production setbacks, while others struggle with ongoing disease outbreaks and economic issues. The overall EU pigmeat production is expected to decline slightly, and exports have become less competitive, particularly with reduced demand from key markets such as China. However, opportunities exist in other Asian countries, where EU exporters are gaining ground. Domestically, consumption is forecast to decrease slightly, reflecting shifting consumer preferences toward plant-based alternatives and poultry.
Poultry: Poultry production is expected to rise, driven by strong domestic demand and favorable export conditions. The EU poultry sector has shown resilience, with increasing production and exports, despite higher input costs. Poultry remains a preferred source of protein for consumers, especially as prices for other meats rise. The sector continues to grow in competitiveness on the international stage, with exports expected to increase in 2024 despite the challenges posed by higher EU prices.
Sheep and Goat Meat: Production of sheep and goat meat continues to decline due to the structural reduction of flocks across the EU. High EU prices have made sheep and goat meat less competitive on the global market, reducing export opportunities. Domestically, consumption remains stable but at lower levels than other meat types. The ongoing structural decline in the sector highlights long-term challenges related to animal health, productivity, and market competitiveness.
Volatility and challenges persist
The report highlights the ongoing challenges faced by the cereals, dairy, and meat sectors. Weather conditions and global trade dynamics are shaping the future of EU agriculture, with many sectors grappling with production declines and shifting market demands. Despite these challenges, opportunities exist for some areas of growth, particularly in dairy and poultry, where rising consumer demand and stable supply conditions offer optimism for the future.
The art of silage: A guide to maximizing quality and nutritional value
by Vesna Jenkins, Global Product Manager, Biomin BioStabil
Silage quality directly impacts animal health and farm profitability. This guide delves into the scientific principles and practical steps necessary to produce silage of the highest caliber.
Optimal Dry Matter
The journey to exceptional silage begins with harvesting at the ideal dry matter percentage. This critical timing ensures the preservation of yield and energy content. Striking the right balance is key; harvesting too early can lead to nutrient-poor silage, while too late can compromise the forage’s structural integrity. Aim for a dry matter content of 32-38% depending on forage type for optimal results.
Wilting Wisdom
When wilting is part of the process (e.g. grass, clover or alfalfa silage), efficiency is paramount. Achieving the desired dry matter in just a few hours help to prevent spoilage and retain the forage’s nutritional value. It’s a delicate dance between removing excess moisture and maintaining the feed’s quality.
Ensiling Excellence
Post-harvest, the clock is ticking. Compacting and sealing the forage within 24 to 48 hours is vital to create an anaerobic environment. This step is crucial to ensure anaerobic conditions for optimal fermentation. Pack the silage in thin layers with heavy enough machinery such as dual wheeled heavy tractors to achieve optimal dry matter density of around 250 kg per cubic meter. Pay special attention to the edges for even compaction. Once filled, seal the clamp with high quality overlapping sheets ensuring the edges are weighted down to prevent air ingress.
Rapid Acidification
The role of silage inoculants cannot be overstated. The proven science of the silage inoculant Biomin® BioStabil accelerates the pH drop, locking in dry matter, energy, and protein. This rapid acidification is a defense mechanism against pathogenic bacteria and mycotoxin producing fungi, ensuring the silage remains safe and nutritious.
Feed-Out Finesse
Proper management of the clamp face is crucial to prevent spoilage and ensure livestock health. Cut sufficient depth fromthe clamp face daily to prevent newly exposed silage near the face from having time to spoil. Maintain a smooth and clean silage face to minimize spoilage. Spilled debris on the ground can easily go moldy, presenting hazards for animals if fed out. Use the proven silage inoculant Biomin® BioStabil for longer aerobic stability in the silage and TMR.
Silage making is both a science and an art. By following these guidelines and choosing the right inoculant, farmers can secure the nutritional integrity of their forage.
Consult with an EW Nutrition representative to select the perfect BioStabil inoculant tailored to your forage type and conditions, and elevate your silage from good to great.
Sustainable livestock farming: Progress since 1950
by Ilinca Anghelescu, Global Director Marketing Communications, EW Nutrition
Summary
Global GHG Emissions and Agriculture:
Agriculture-related emissions account for 31% of global anthropogenic emissions, with a growing share coming from food-related activities outside traditional farming, such as processing and transportation.
This represents a significant decrease from the 1950s when agriculture contributed to 58% of global emissions, a decrease largely due to the increased use of fossil fuels.
Population Growth and Emissions:
The global population has increased by 220% since 1950, leading to a threefold increase in agri-food emissions, now totaling 9-10 billion metric tons of CO2-equivalent annually.
Meat Production Growth:
Meat production has seen a 690% increase since 1950, driven by population growth, economic development, urbanization, technological advancements, and intensification of livestock production.
Technological improvements have significantly increased livestock yield, including higher carcass weights, improved feed efficiency, and greater output per animal.
Feed Conversion Ratio (FCR) as a Sustainability Metric:
FCR, which measures the efficiency of feed conversion into body mass, has improved dramatically for poultry, pigs, and cattle since the 1950s.
Improved FCR contributes to more efficient resource use, reduced environmental impact, better animal welfare, and economic viability.
Livestock Emissions and Land Use:
Livestock-related emissions have increased by 14% since 2000, with a significant portion coming from enteric fermentation in ruminants and land use changes.
Pasture and grazing land have expanded slightly, while the land for feed crops has increased substantially due to intensified livestock production.
Food Loss and Its Impact on Sustainability:
Food loss, occurring primarily before the consumer stage, remains stable at around 13%. Reducing food loss is critical for improving food security, economic efficiency, and minimizing the environmental footprint of livestock production.
Future Strategies for Sustainability:
The article emphasizes the need for ongoing investment in technology, optimization of feed efficiency, sustainable land use, and improved methods for tracking and reducing emissions to ensure the future sustainability of livestock farming.
As the global demand for animal products continues to rise, so do various claims about the impact of agriculture on greenhouse gas emissions. A study commissioned by the United Nations’ Food and Agriculture Organization (FAO) concluded that, according to the most recent data, agri-food system emissions totaled 16.5 billion metric tons of CO2 equivalent, representing 31% of global anthropogenic emissions.
Of these 31%, the most important trend highlighted by FAO was the “increasingly important role of food-related emissions generated outside of agricultural land, in pre- and post-production processes along food supply chains”. The food supply chain (food processing, packaging, transport, household consumption and waste disposal) is thus set to become the top GHG emitter, above farming and land use.
How bad is 31%?
While 31% is a large figure, even this estimate represents a significant decrease from the 1950s, when agri-food emissions constituted approximately 58% of total anthropogenic emissions: “From 1850 until around 1950, anthropogenic CO2 emissions were mainly (>50%) from land use, land-use change and forestry”, states the latest IPCC report.
Figure 1. Source: IPCC AR6 Report, 2023. LULUCF = Land Use, Land-Use Change and Forestry
As the IPCC graph in Figure 1 indicates, the percentage decrease is mostly due to the rising prevalence of oil and coal in CO2 emissions over the recent decades, as shown in Figure 2 below.
Annual greenhouse gas (GHG) emissions worldwide from 1990 to 2022, by sector (in million metric tons of carbon dioxide equivalent)
Total population and agri-food emission changes, 1950 – today
The global population increased by approximately 220%, from 2.5 billion in 1950 to 8 billion in 2023. In the meantime, estimates suggest that, in the 1950s, agri-food systems were responsible for approximately 2-3 billion metric tons of CO2-equivalent (CO2e) emissions per year. This figure includes emissions from livestock, rice paddies, fertilizer use, and land-use change (e.g., deforestation for agriculture).
Assessments generally agree that today’s agri-food systems contribute approximately 9-10 billion metric tons of CO2e annually, a threefold increase from 1950. This includes emissions from agriculture (e.g., livestock, crop production), food processing, transportation, and land-use changes.
This increase is consistent with FAO’s new findings, of food chain climbing to the top of agri-food emitters.
But where did these increased emissions come from?
A look at the graph below gives us an indication: world poverty rate decreased massively between 1950 and today. While COVID brought a setback, the historical data would clearly indicate a correlation between the increased output in agri-food systems and the decreased rate of poverty.
How did poverty rates decline so steeply? The reasons lie, to a large extent, in technological innovation, especially in genetics and farm management, and in the increased apport of plentiful and affordable meat protein to the world. The numbers below build an image of an industry that produces better, more, and cheaper.
Global meat production: 1950 vs. Present
Then…
In 1950, the estimated total meat production was of approximately 45 million metric tons.
Key Producers: The United States, Europe, and the Soviet Union were the primary producers of meat. Types of Meat: Production was largely dominated by beef and pork, with poultry being less significant.
…and now
Now, the total meat production lies somewhere around 357 million metric tons (as of recent data from FAO)., representing a 53% increase from 2000 and a staggering 690% increase from 1950.
Key Producers: Major producers include China, the United States, Brazil, and the European Union. Types of Meat: Significant increases in poultry production, with pork remaining a leading source of meat, especially in Asia. Beef production has also increased, but at a slower rate than poultry and pork.
Factors contributing to increased meat production
Population Growth: The world population has grown from approximately 2.5 billion in 1950 to over 8 billion today, driving increased demand for meat.
Economic Growth and Urbanization: Rising incomes and urbanization have led to shifts in economic power and dietary preferences, with more people consuming higher quantities of meat, especially in developing countries.
Technological Advancements: Improvements in animal breeding, feed efficiency, and production systems have increased the efficiency and output of meat production.
Intensification of Livestock Production: The shift from extensive to intensive livestock production systems has allowed for higher meat yields per animal.
Global Trade: Expansion of global trade in meat and meat products has facilitated the growth of production in countries with comparative advantages in livestock farming.
Livestock yield increase, 1950 to the present
The increase in livestock yield for cattle, pigs, and chickens between 1950 and the present has been significant due to advances in breeding, nutrition, management practices, and technology.
Beef
1950s
Average Carcass Weight: In the 1950s, the average carcass weight of beef cattle was about 200 to 250 kilograms (440 to 550 pounds).
Dressing Percentage: The dressing percentage (the proportion of live weight that becomes carcass) was typically around 50-55%.
Present Day
Average Carcass Weight: Today, the average carcass weight of beef cattle is approximately 300 to 400 kilograms (660 to 880 pounds).
Dressing Percentage: The dressing percentage has improved to about 60-65%.
Increase in Beef Cattle Yield
Increase in Carcass Weight: The average carcass weight has increased by about 100 to 150 kilograms (220 to 330 pounds) per animal.
Improved Dressing Percentage: The dressing percentage has increased by about 5-10 percentage points, meaning a greater proportion of the live weight is converted into meat.
Dairy
1950s
Average Milk Yield per Cow: Approximately 2,000 to 3,000 liters per year, depending on the region.
Present Day
Average Milk Yield per Cow: Approximately 8,000 to 10,000 liters per year globally, with some countries like the United States achieving even higher averages of 10,000 to 12,000 liters per year.
Increase in Milk Yield:: Milk yield per cow has increased about 4-5 times due to genetic selection, improved nutrition, technological advancements, and better herd management.
Chickens (Layers)
1950s
Average Egg Production per Hen: In the 1950s, a typical laying hen produced about 150 to 200 eggs per year.
Present Day
Average Egg Production per Hen: Today, a typical laying hen produces approximately 280 to 320 eggs per year, with some high-performing breeds producing even more.
Increase in Egg Yield: The average egg production per hen has increased by approximately 130 to 170 eggs per year.
Chickens (Broilers)
1950s
Average Yield per Bird: In the 1950s, broiler chickens typically reached a market weight of about 1.5 to 2 kilograms (3.3 to 4.4 pounds) over a growth period of 10 to 12 weeks.
Present Day
Average Yield per Bird: Today, broiler chickens reach a market weight of about 2.5 to 3 kilograms (5.5 to 6.6 pounds) in just 5 to 7 weeks.
Increase in Yield: The average weight of a broiler chicken has increased by approximately 1 to 1.5 kilograms (2.2 to 3.3 pounds) per bird. Additionally, the time to reach market weight has been nearly halved.
Factors contributing to yield increases
Genetic Improvement:
Selective Breeding: Focused breeding programs have developed chicken strains with rapid growth rates and high feed efficiency, significantly increasing meat yield.
Nutrition:
Optimized Feed: Advances in poultry nutrition have led to feed formulations that promote faster growth and better health, using balanced diets rich in energy, protein, and essential nutrients.
Management Practices:
Housing and Environment: Improved housing conditions, including temperature and humidity control, have reduced stress and disease, enhancing growth rates.
Technological Advancements:
Automation: Automation in feeding, watering, and waste management has improved efficiency and bird health.
Health Monitoring: Advances in health monitoring and veterinary care have reduced mortality rates and supported faster growth.
Feed Conversion Efficiency:
Improved Feed Conversion Ratios (FCR): The amount of feed required to produce a unit of meat has decreased significantly, making production more efficient.
Why Feed Conversion Ratio is a sustainability metric
Feed Conversion Ratio (FCR) is a critical metric in livestock production that measures the efficiency with which animals convert feed into body mass. It is expressed as the amount of feed required to produce a unit of meat, milk, or eggs. Advances in nutrition and precision feeding allow producers to tailor diets that optimize FCR, reducing waste and improving nutrient uptake. Also, breeding programs focused on improving FCR can lead to livestock that naturally convert feed more efficiently, supporting long-term sustainability.
Poultry (Broilers): From the 1950s, improved from approximately 4.75 kg/kg to 1.7 kg/kg.
Pigs: From the 1950s, improved from about 4.5 kg/kg to 2.75 kg/kg.
Cattle (Beef): From the 1950s, improved from around 7.5 kg/kg to 6.0 kg/kg.
Figure 4. Evolution of FCR from 1950
FCR is crucial for livestock sustainability for several reasons, as shown below.
1. Resource efficiency
– Feed Costs: Feed is one of the largest operational costs in livestock production. A lower FCR means less feed is needed to produce the same amount of animal product, reducing costs and improving profitability.
– Land Use: Efficient feed conversion reduces the demand for land needed to grow feed crops, helping to preserve natural ecosystems and decrease deforestation pressures.
– Water Use: Producing less feed per unit of animal product reduces the water needed for crop irrigation, which is crucial in regions facing water scarcity.
2. Environmental impact
– Greenhouse Gas Emissions: Livestock production is a significant source of greenhouse gases (GHGs), particularly methane from ruminants and nitrous oxide from manure management. Improved FCR means fewer animals are needed to meet production goals, reducing total emissions.
– Nutrient Runoff: Efficient feed use minimizes excess nutrients that can lead to water pollution through runoff and eutrophication of aquatic ecosystems.
3. Animal welfare
– Health and Growth: Optimizing FCR often involves improving animal health and growth rates, which can lead to better welfare outcomes. Healthy animals grow more efficiently and are less susceptible to disease.
4. Economic viability
– Competitiveness: Lowering FCR improves the economic viability of livestock operations by reducing input costs and increasing competitiveness in the global market.
– Food Security: Efficient livestock systems contribute to food security by maximizing the output of animal protein relative to the input of resources.
Improving FCR is essential for achieving sustainability in livestock production. It leads to more efficient resource use, reduced environmental impact, enhanced economic viability, and supports the well-being of animals. As global demand for animal products continues to rise, optimizing FCR will be crucial in balancing production with the need to protect and preserve natural resources.
“The eight warmest years on record since 1961 (and in fact since the beginning of observations in 1880) are all within the eight-year period of 2015–2022. Europe is the region where the temperature change has been the highest in 2022 (and also for most of the 2000–2022 period), with 2.23 °C, followed by Asia (1.75 °C), the Americas (1.05 °C), Africa (1.01 °C) and Oceania (0.8 °C). The average temperature change in the 2010s was 1.25 °C, compared to 0.96 °C in the 2000s.” FAOSTAT 2023
Livestock emissions
Livestock emissions can be direct (farm-gate) or indirect (land use). Pre- and post-production emissions are considered separately, since they refer to emissions from manufacturing, processing, packaging, transport, retail, household consumption, and waste disposal.
Global farm-gate emissions (related to the production of crops and livestock) grew by 14% between 2000 and 2021, to 7.8 Gt CO2 eq, see below. 53% come from livestock-related activities, and the emissions from enteric fermentation generated in the digestive system of ruminant livestock were alone responsible for 37 percent of agricultural emissions (FAOSTAT 2023).
Land use emissions contribute a large share to agricultural emissions overall, especially through deforestation (~74% of land-use GHG emissions). The numbers have declined in recent years, to a total of 21% reduction between 2000 and 2018.
The other side of the coin is represented by the increased land usage for livestock, either directly for grazing or indirectly for feed crops.
1. Pasture and grazing land
1950: Approximately 3.2 billion hectares (7.9 billion acres) were used as permanent pastures.
Present: The area has increased to around 3.5 billion hectares (8.6 billion acres).
Change: An increase of about 0.3 billion hectares (0.7 billion acres).
2. Land for Feed Crops
1950: The land area dedicated to growing feed crops (such as corn and soy) was significantly less than today due to lower livestock production intensities and smaller scale operations. Feed crops likely accounted for about 200-250 million hectares of the cropland, although figures are evidently difficult to estimate.
Present: Of the approx. 5 billion hectares of land globally used for agriculture, about 1.5 billion hectares are dedicated to cropland.
The increase in cropland hectares is a direct consequence of the intensification of demand for livestock production. To keep these numbers in check, it is essential that producers strive to use as little feed as possible for as much meat yield as possible – and this directly relates to a key metric of the feed additive industry: Feed Conversion Ratio, mentioned above.
The role of food loss in livestock sustainability
The Food and Agriculture Organization (FAO) of the United Nations definesfood loss as the decrease in quantity or quality of food resulting from decisions and actions by food suppliers in the chain, excluding retail, food service providers, and consumers. Food loss specifically refers to food that gets spilled, spoiled, or lost before it reaches the consumer stage, primarily taking place during production, post-harvest, processing, and distribution stages.
Food loss is currently estimated to be relatively stable over the last decades, at around 13%.
Key aspects of food loss
Stages of Food Loss:
Production: Losses that occur during agricultural production, including damage by pests or diseases and inefficiencies in harvesting techniques.
Post-Harvest Handling and Storage: Losses that happen due to inadequate storage facilities, poor handling practices, and lack of proper cooling or processing facilities.
Processing: Losses during the processing stage, which may include inefficient processing techniques, contamination, or mechanical damage.
Distribution: Losses that occur during transportation and distribution due to poor infrastructure, inadequate packaging, and logistical inefficiencies.
Quality and Quantity:
Quality Loss: Refers to the reduction in the quality of food, affecting its nutritional value, taste, or safety, which may not necessarily reduce its quantity.
Quantity Loss: Refers to the actual reduction in the amount of food available for consumption due to physical losses.
Exclusions:
Retail and Consumer Level: Food loss does not include food waste at the retail or consumer levels, which is categorized as food waste. Food waste refers to the discarding of food that is still fit for consumption by retailers or consumers.
Importance of reducing food loss
Every step along the production chain, each action taken to preserve feed, increase yield, ensure stable and high meat quality, can contribute to reducing food loss and ensuring that animal protein production stays sustainable and feeds the world more efficiently.
Food Security: Reducing food loss can help improve food availability and access, particularly in regions where food scarcity is a concern. Where we thought we were on our way to eradicate world hunger, recent upticks in several regions show us that progress is not a given.
Economic Efficiency: Minimizing food loss can improve the efficiency and profitability of food supply chains by maximizing the utilization of resources.
Environmental Impact: Reducing food loss helps to decrease the environmental footprint of food production by lowering greenhouse gas emissions and minimizing land and water use. This is all the more important in regions where world hunger shows signs of going up. Perhaps not by coincidence are these regions some of the most affected by climate change.
By understanding and addressing the causes of food loss, stakeholders across the food supply chain can work towards more sustainable and efficient food systems.
What’s next?
Improving production practices and technology
Investment in research and development of new technologies that enhance livestock production efficiency and reduce environmental impact is vital for the future sustainability of the sector.
India is a good illustration of room to grow. If we look at cow milk alone, India, with a headcount of approximately 61 million animals, has a total milk production that is neck-and-neck with the United States, whose dairy cow headcount is in the neighborhood of 9.3 million. India’s milk yield sits around 1,600 liters/animal/year, compared to the US’s average of 10,700 liters.
Continued focus on improving FCR through genetic selection, optimized nutrition, and advanced management practices will be crucial for reducing the environmental footprint of livestock production.
Promoting Sustainable Land Use
Strategies to balance the need for increased livestock production with sustainable land use practices are essential. This includes adopting agroecological approaches and improving the efficiency of feed crop production.
Reducing Food Loss
Stakeholders across the food supply chain must prioritize reducing food loss through improved storage, transportation, and processing technologies. This will help ensure that livestock production contributes effectively to global food security.
Enhancing Emission Tracking and Reporting
There is a need for standardized methods for collecting and reporting data on GHG emissions in agriculture. This will enable more accurate assessments and the development of targeted strategies for emission reductions.
References
Bell, D. D. (2002). Laying hens in the U.S. market: An appraisal of trends from the beginning of the 20th century to present. Poultry Science, 81(5), 485-490. https://doi.org/10.1093/ps/81.5.485
Crippa, M., Solazzo, E., Guizzardi, D., Monforti-Ferrario, F., Tubiello, F. N., Leip, A., … & Janssens-Maenhout, G. (2022). Greenhouse gas emissions from food systems: building the global food system emissions database (GFED). Earth System Science Data, 14(4), 1795-1821. https://essd.copernicus.org/articles/14/1795/2022/essd-14-1795-2022.pdf
Goldewijk, K. K., & Verburg, P. H. (2013). Per-capita estimations of long-term historical land use and the consequences for global change research. Global Environmental Change, 23(4), 1166-1175. https://doi.org/10.1016/j.gloenvcha.2013.04.001
Kusuma, A. B., Laga, W. R., & Purnomo, H. (2022). Climate Change and Livestock Farming: Strategies for Mitigation and Adaptation. MDPI, 12(10), 1554. https://www.mdpi.com/2077-0472/12/10/1554
Roche, J. R., Friggens, N. C., Kay, J. K., Fisher, M. W., Stafford, K. J., & Berry, D. P. (2013). Invited review: Body condition score and its association with dairy cow productivity, health, and welfare. Animal Frontiers, 3(4), 23-29. https://doi.org/10.2527/af.2013-0032
Thornton, P. K., & Herrero, M. (2015). Impacts of climate change on the livestock food supply chain; a review of the evidence. Frontiers in Veterinary Science, 2, 93. https://www.ncbi.nlm.nih.gov/pmc/articles/PMC4686767/
Zuidhof, M. J., Schneider, B. L., Carney, V. L., Korver, D. R., & Robinson, F. E. (2014). Evolution of the modern broiler and feed efficiency. Annual Review of Animal Biosciences, 2(1), 47-71. https://doi.org/10.1146/annurev-animal-022513-114132
Global antimicrobial use in livestock farming: A revised estimate
Antimicrobial resistance (AMR) poses a significant threat to global health, driven by the overuse and misuse of antibiotics in both human medicine and livestock farming. In livestock farming, antimicrobials are still used extensively for therapeutic and non-therapeutic purposes. However, estimates of the quantities used per species are notoriously hard to derive from fragmented, incomplete, or unstandardized data around the world.
A recent article (“Global antimicrobial use in livestock farming: an estimate for cattle, chickens, and pigs”, Animal, 18(2), 2024) attempts to update the figures by estimating global biomass at treatment of cattle, pigs, and chickens, considering distinct weight categories for each species in biomass calculation, and using the European Medicines Agency’s weight standards for the animal categories. With these more refined calculations, authors Zahra Ardakani, Maurizio Aragrande, and Massino Canali aim to provide a more accurate estimate of global antimicrobial use (AMU) in cattle, chickens, and pigs. Understanding these patterns is crucial for addressing AMR and developing strategies for sustainable livestock management.
Key Findings
The study estimates that the global annual AMU for cattle, chickens, and pigs amounts to 76,060 tons of antimicrobial active ingredients. This is a significant revision from previous estimates due to a more detailed evaluation of animal weights and categories:
1. Cattle: 40,697 tons (53.5% of total AMU)
2. Pigs: 31,120 tons (40.9% of total AMU)
3. Chickens: 4,243 tons (5.6% of total AMU)
Figure 1: Distribution of global antimicrobial use among cattle, pigs, and chickens.
Methodology
The study utilizes the concept of Population Correction Units (PCU) to estimate antimicrobial usage, taking into account the weight and category of livestock at the time of treatment. This method differs from previous approaches that relied on live weight at slaughter, providing a more accurate representation of AMU.
The PCU is calculated by multiplying the number of animals by their average weight during treatment. This approach allows for differentiation by age and sex, which is particularly important for species like cattle and pigs.
Figure 2: (a) Changes in global PCU (million tonnes), (b) changes in global antibiotic use in mg per PCU, and (c) changes in global AMU (thousand tonnes) for cattle, chickens, and pigs; between 2010 and 2020. Abbreviations: PCU = Population Correction Unit; AMU = Antibiotic Use.
Figure 2: (a) Changes in global PCU (million tonnes), (b) changes in global antibiotic use in mg per PCU, and (c) changes in global AMU (thousand tonnes) for cattle, chickens, and pigs; between 2010 and 2020. Abbreviations: PCU = Population Correction Unit; AMU = Antibiotic Use.
Study shows lower AMU than previous estimates
The study highlights a significant shift in AMU patterns, with chickens showing a remarkable decrease in antimicrobial use despite increased production. This is indicative of improved management and more responsible use of antibiotics in the poultry industry.
The lower AMU in cattle and pigs, compared to previous estimates, underscores the importance of considering animal age and weight at treatment. These findings align closely with World Organization for Animal Health (WOAH) estimates, validating the methodology.
However, the study also acknowledges limitations, including reliance on European standards for average weight at treatment, which may not reflect global variations. Additionally, the lack of comprehensive global data on veterinary antibiotics presents challenges in creating fully accurate estimates.
Corrected estimate highlights improved production advances
This study provides a revised and potentially more accurate estimate of global antimicrobial use in livestock. By accounting for the weight and treatment categories of animals, it offers insights that could guide policy and management practices to mitigate the spread of antimicrobial resistance.
The article also indicates that the industry may have over-estimated antimicrobial usage in livestock and, just as importantly, that antimicrobial use has been kept in check or even reduced, despite increases in farmed animal headcounts. The lower usage is likely due to regulatory oversight and improvements in alternative methods to control and mitigate health challenges.



 .
.