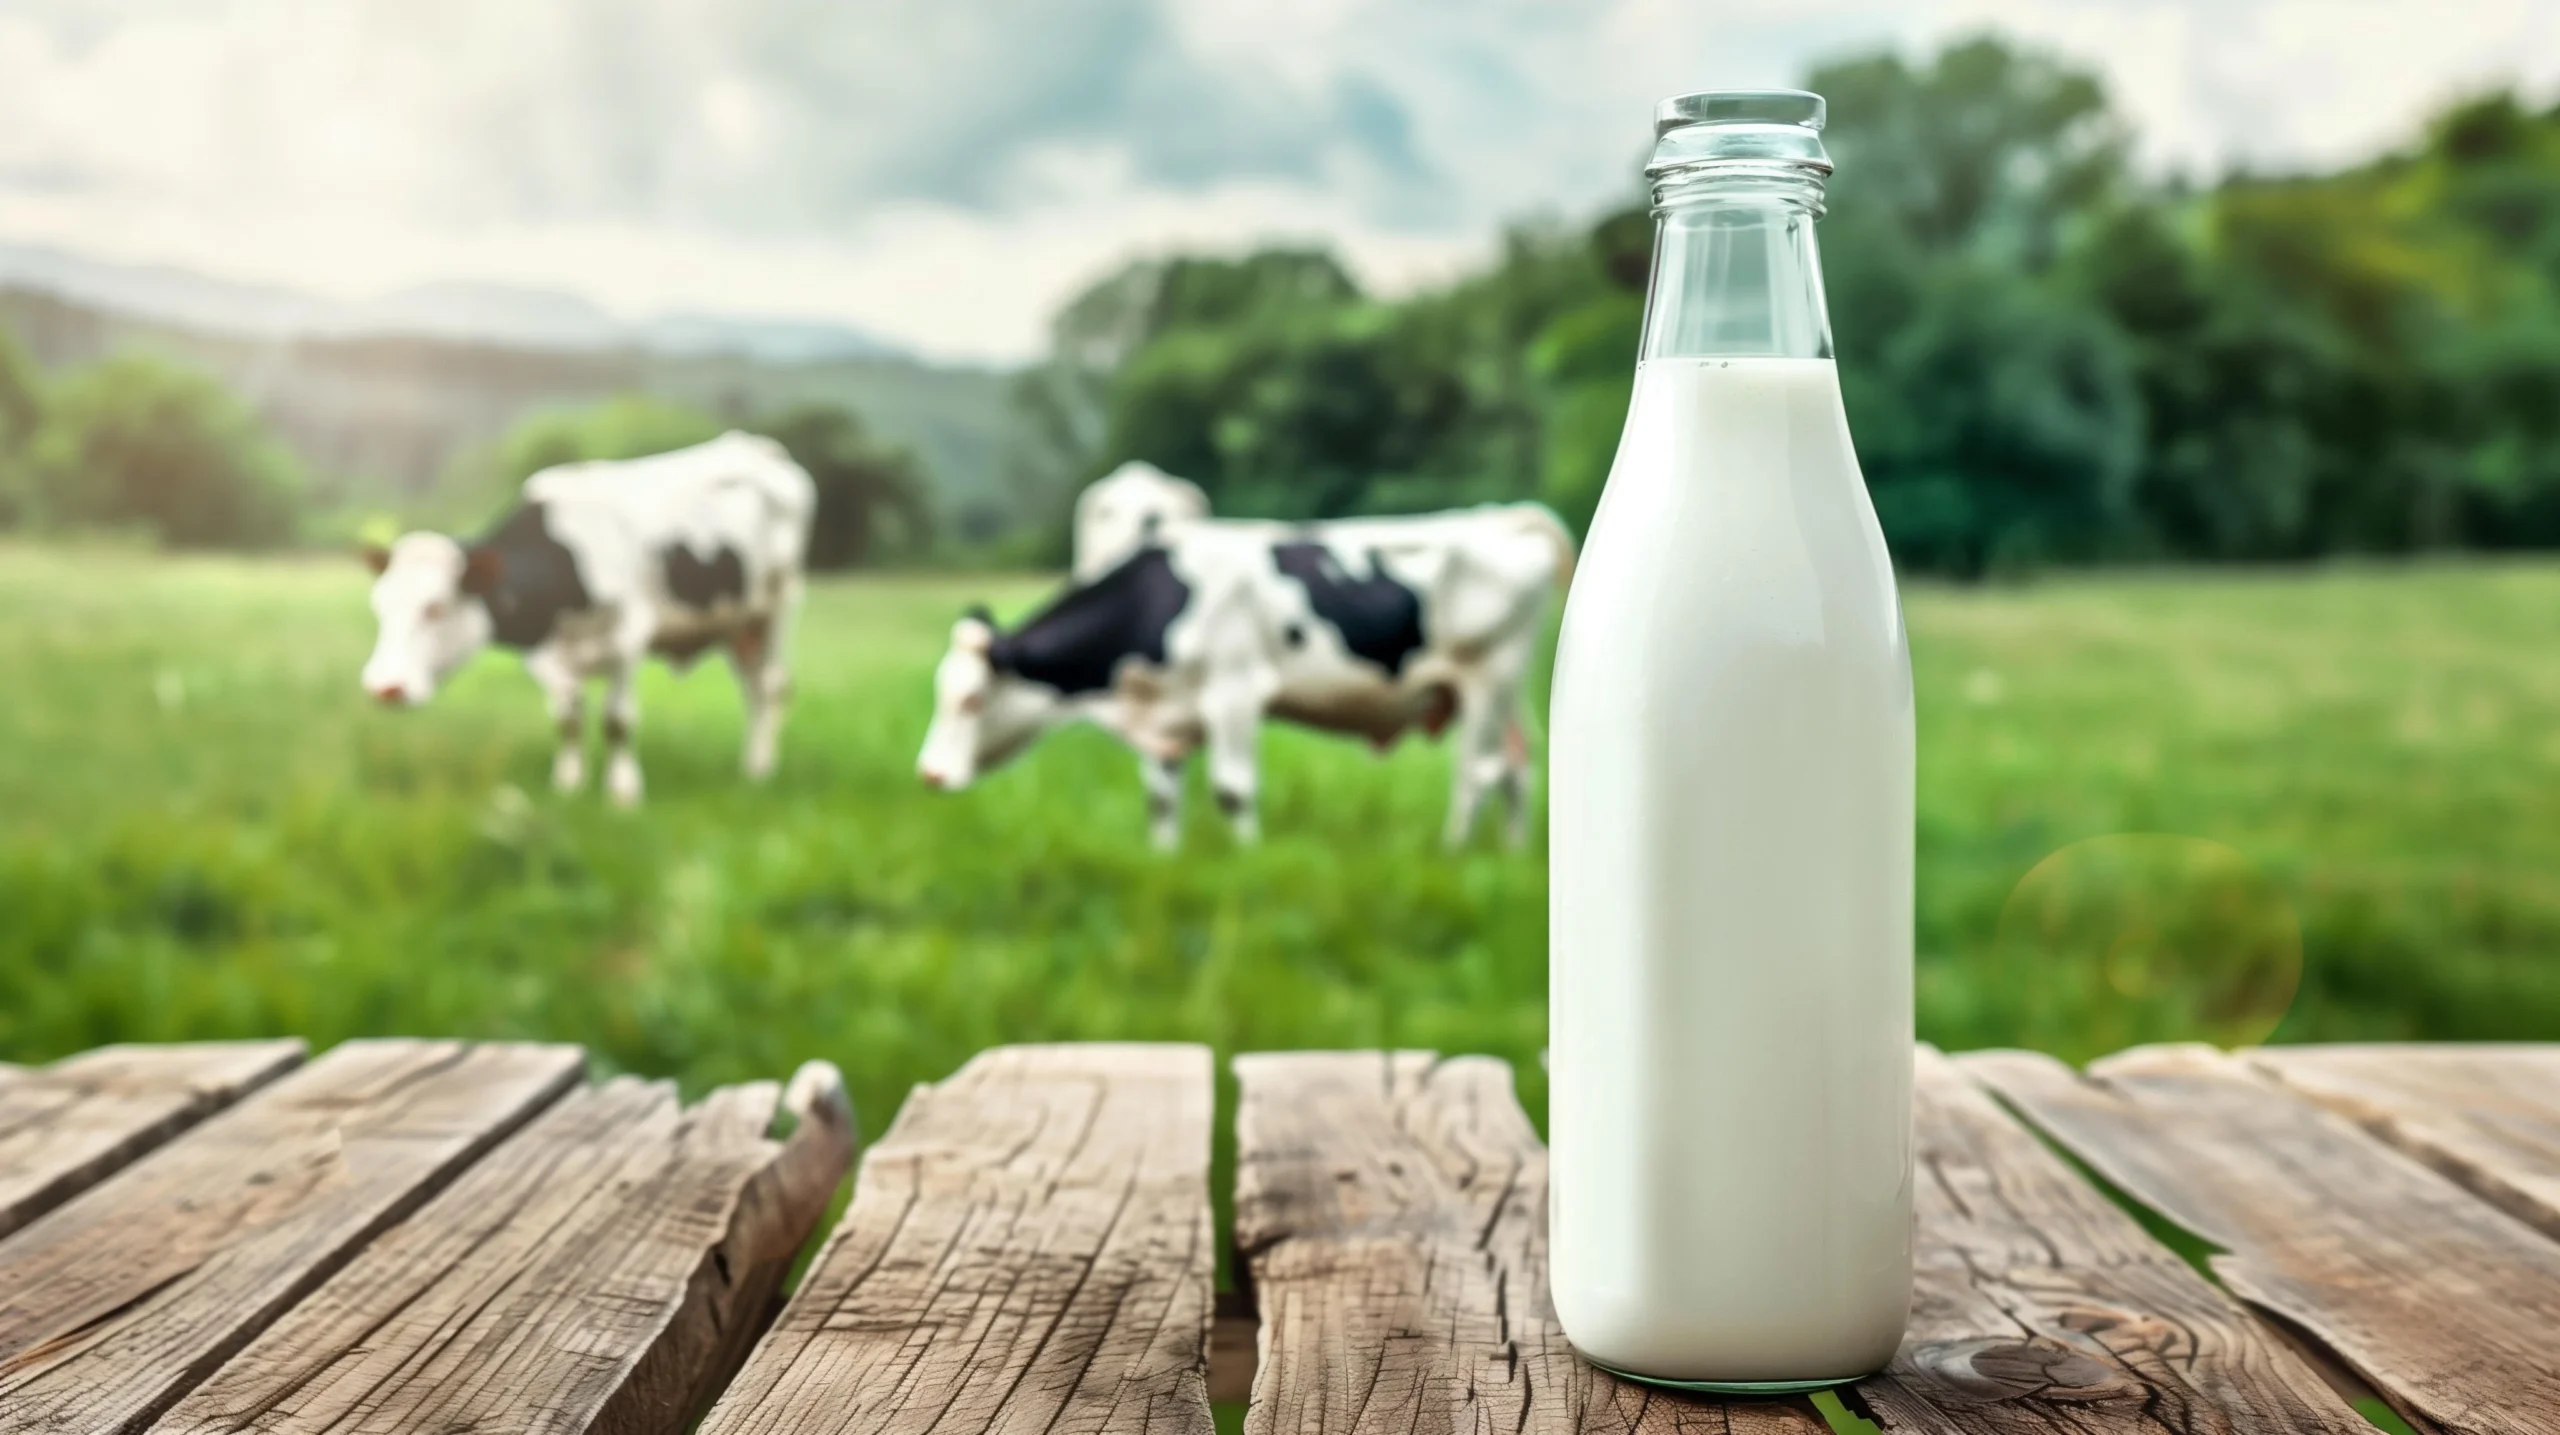
Shifting Consumer Preferences in Dairy: The Higher Demand for High-Protein Milk in the GLP-1 Era
Author: Valentina Mayorga and Inge Heinzl, EW Nutrition
Today, the dairy market is undergoing a remarkable transformation. Demand is no longer focused solely on volume or fat content, but rather on a specific component: protein. But why is protein suddenly at the center of consumer attention? Recent estimates indicate that approximately one in eight adults (12%) in the United States is currently using a GLP-1 medication such as Ozempic or Wegovy for weight loss or chronic disease management (Lacsamana, 2025). By significantly reducing appetite and overall caloric intake, these medications may increase the risk of muscle mass loss in the absence of adequate nutritional planning, particularly when protein intake is insufficient.
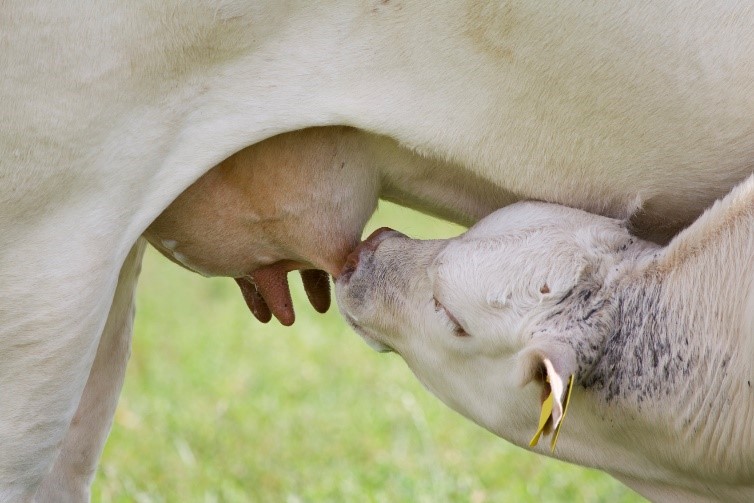
Humans and animals compete for high-protein products
For this reason, consumers are increasingly seeking high-quality protein sources, particularly those rich in whey protein, known for its high biological value and rapid digestibility. However, this shift in consumer demand also creates a new challenge for the feed industry. Whey protein, traditionally used by feed mills as a highly digestible ingredient for young animals, is increasingly being diverted to human nutrition markets, creating direct competition for this valuable protein source. Either way, dairy consumption is growing, but not uniformly across all categories. The increase is concentrated in products with lower fat content and higher protein density, such as cottage cheese, premium Greek yogurt, and whey-protein-enriched milk beverages. The protein market is accelerating, and in an industry that rewards adaptation, standing still is simply another way of moving backward.
This shift in what consumers care about raises a key question for dairy farmers: how can they increase milk protein content through farm nutrition practices? Improving milk protein content isn’t just about putting more protein into the diet. It needs a balanced nutritional approach that supports rumen function, promotes microbial protein synthesis, and maintains overall metabolic function. With the right feed mix, farms can better meet consumers’ changing tastes.
Increase milk protein with higher energy intake
Milk protein synthesis is primarily driven by energy intake, particularly fermentable energy. When cows consume more metabolizable energy (ME), rumen microbial activity increases, leading to greater microbial protein synthesis. Since microbial protein represents the main source of metabolizable amino acids absorbed in the small intestine, improving rumen efficiency directly supports higher milk protein production. Research has shown that increasing concentrate intake is associated with increases in milk protein concentration, with a response of approximately +0.06 percentage units per additional 10 MJ of ME intake per day. This response occurs because higher energy intake increases dry matter intake, improves nitrogen utilization, enhances microbial growth, and ultimately increases the supply of metabolizable protein to the mammary gland. Importantly, the source of energy matters. Energy derived from fermentable carbohydrates, particularly starch and sugars, is far more effective at stimulating microbial protein synthesis than energy derived from fat.
Starch plays a crucial role
Among fermentable carbohydrates, starch plays a central role in increasing milk protein concentration. When starch in the diet increases, rumen fermentation produces more propionate. Propionate is absorbed and converted in the liver into glucose through gluconeogenesis. Glucose is essential for lactose synthesis in the mammary gland, and lactose regulates milk volume through osmotic pressure. At the same time, improved energy status enhances microbial protein synthesis, increasing the availability of amino acids for casein production. This makes increasing dietary starch one of the most influential nutritional strategies for enhancing milk protein concentration.
Replacing grass silage with forages higher in starch and sugars, such as maize silage or fodder beet, can increase total energy intake, milk yield, and milk protein concentration. However, starch must be carefully balanced with adequate fiber. Excessively low fiber levels can reduce rumen pH, leading to acidosis, decreased feed intake, milk fat depression, and compromised animal health. Therefore, the objective is not simply high starch inclusion but rather high fermentable energy within a stable rumen environment, supported by sufficient physically effective fiber.
Effective protein strategies coordinate the supply of fermentable energy and degradable protein
Feeding more crude protein alone does not increase milk protein concentration. If degradable protein exceeds the availability of fermentable energy, excess nitrogen is converted into urea, reducing nitrogen efficiency and increasing milk urea nitrogen (MUN) without improving milk protein yield. Instead, effective protein strategies involve synchronizing rumen-degradable protein (RDP) with fermentable carbohydrates to maximize microbial growth, while also providing adequate rumen-undegradable protein (RUP) to supply metabolizable amino acids directly to the intestine. Precision supplementation of limiting amino acids, particularly methionine between 2.4-2.5% and lysine between 7.2-7.5% of metabolizable protein (MP), ensures a crucial 3:1 ratio, supporting casein synthesis in the mammary gland and improving true milk protein yield.
Feeding is one thing, genetics is another
Under optimized nutritional management, realistic improvements in milk protein concentration can be achieved. In Holstein cows, which typically average around 3.1% protein, levels can increase to approximately 3.3–3.5%. In Jersey cows, which average around 3.9%, protein concentration may increase to approximately 4.1–4.3% with well-balanced diets and excellent management. Increases beyond these ranges generally require genetic selection in addition to nutritional adjustments.
Higher protein production is possible…up to a certain degree
High-starch diets often increase milk protein while potentially lowering milk fat percentage. This occurs because increased propionate production is associated with reduced acetate formation, and acetate is the primary precursor for milk fat synthesis. For consumers seeking dairy products with higher protein and lower fat content (particularly individuals aiming to preserve muscle mass while reducing caloric intake), this shift in milk composition may align with emerging market demands. However, excessive starch without adequate fiber can negatively impact rumen health, emphasizing the importance of nutritional balance.
References
Chamberlain, A. T., and J. M. Wilkinson. Feeding the dairy cow. Mountwood House: Chalcombe Publications, 2011.
EU publishes Short-term Outlook for Agricultural Markets (Autumn 2024)
The EU’s Short-term Outlook for Agricultural Markets (Autumn 2024) reveals significant challenges in agriculture, with adverse weather, geopolitical instability, and fluctuating trade conditions impacting production. The report identifies declining cereal and oilseed outputs, particularly for soft wheat and maize. Meanwhile, milk production is expected to remain stable despite a shrinking cow herd, and the meat sector shows mixed trends, with poultry production rising but pigmeat and beef facing structural challenges.
EU’s Short-term Outlook for Autumn 2024 highlights the following key findings collectively shaping EU agricultural markets:
Weather conditions: Severe drought in Southern and Eastern Europe and excess rainfall in Northwestern regions have reduced cereal and oilseed yields.
Energy and input costs: Inflation is stabilizing but remains high, with elevated prices for inputs like fertilizers and energy.
Geopolitical tensions: The ongoing war in Ukraine and trade disputes are disrupting supply chains and impacting exports.
Global demand: While global agricultural demand is recovering, trade flows face disruptions due to regulatory changes and volatile market conditions.
Cereals
The EU cereal production in 2024/25 is projected at 260.9 million tons, approximately 7% below the 5-year average. This marks the lowest production in the past decade, driven by unfavorable weather conditions, including excessive rain in Northwestern Europe, which impacted planting, particularly for soft wheat, and drought in Southern and Eastern regions, severely affecting maize yields. Production of soft wheat and maize is expected to decline year-on-year by 9.5% and 4%, respectively. On the other hand, barley and durum wheat production are increasing by about 6% and 3%, respectively, compared to the previous year.
EU cereal exports are projected to decline by 22% year-on-year due to reduced production and quality issues. At the same time, domestic demand remains relatively stable, with animal feed consumption holding steady as livestock production stagnates. In terms of prices, cereal prices fell throughout 2024, pressuring farmers’ cash flow, which could hinder their ability to afford inputs such as fertilizers in the coming year.
Milk and Dairy Products
The EU milk market is expected to see relatively stable supply, despite a continuously shrinking cow herd. Milk yields have increased, compensating for the herd’s decline. Milk prices are forecast to stabilize after a period of volatility in the past few years, remaining above historical averages, and input costs for farmers, such as feed and energy, are showing signs of stabilizing, allowing for a potential improvement in farmer margins.
Despite the stability in milk supply, demand for dairy products continues to show mixed trends, influenced by shifts in consumer preferences and trade dynamics. The balance of milk supply and prices could provide an opportunity for dairy farmers to recover some profitability after several challenging years.
In the dairy products sector, cheese and butter continue to dominate EU production, with butter production projected to rise slightly in 2024, driven by stable milk supplies and strong domestic demand. The demand for butter in the global market remains relatively strong, although competition is rising.
Cheese production is also expected to remain stable, reflecting a balance between domestic and export markets. The cheese sector has seen steady growth over the years, supported by increasing consumer demand for premium and specialty cheeses. The demand for skimmed milk powder (SMP) and whole milk powder (WMP) is projected to remain subdued due to fluctuating global demand, particularly from key markets such as China, although some growth is expected in non-European markets.
Meat Products
The meat sector in the EU remains a mixed picture, with structural changes and external factors shaping production and trade in 2024.
Beef and Veal: Beef production continues to face structural decline due to a shrinking herd size, with the sector stabilizing but at lower levels of production. The demand for EU beef remains relatively high, and exports are increasing, but domestic production is likely to remain constrained by environmental and economic pressures. Additionally, the number of animals has been declining consistently, reflecting longer-term trends within the EU beef industry.
Pigmeat: The EU pigmeat sector is facing diverse challenges, with some countries recovering from production setbacks, while others struggle with ongoing disease outbreaks and economic issues. The overall EU pigmeat production is expected to decline slightly, and exports have become less competitive, particularly with reduced demand from key markets such as China. However, opportunities exist in other Asian countries, where EU exporters are gaining ground. Domestically, consumption is forecast to decrease slightly, reflecting shifting consumer preferences toward plant-based alternatives and poultry.
Poultry: Poultry production is expected to rise, driven by strong domestic demand and favorable export conditions. The EU poultry sector has shown resilience, with increasing production and exports, despite higher input costs. Poultry remains a preferred source of protein for consumers, especially as prices for other meats rise. The sector continues to grow in competitiveness on the international stage, with exports expected to increase in 2024 despite the challenges posed by higher EU prices.
Sheep and Goat Meat: Production of sheep and goat meat continues to decline due to the structural reduction of flocks across the EU. High EU prices have made sheep and goat meat less competitive on the global market, reducing export opportunities. Domestically, consumption remains stable but at lower levels than other meat types. The ongoing structural decline in the sector highlights long-term challenges related to animal health, productivity, and market competitiveness.
Volatility and challenges persist
The report highlights the ongoing challenges faced by the cereals, dairy, and meat sectors. Weather conditions and global trade dynamics are shaping the future of EU agriculture, with many sectors grappling with production declines and shifting market demands. Despite these challenges, opportunities exist for some areas of growth, particularly in dairy and poultry, where rising consumer demand and stable supply conditions offer optimism for the future.
Sustainable livestock farming: Progress since 1950
by Ilinca Anghelescu, Global Director Marketing Communications, EW Nutrition
Summary
Global GHG Emissions and Agriculture:
Agriculture-related emissions account for 31% of global anthropogenic emissions, with a growing share coming from food-related activities outside traditional farming, such as processing and transportation.
This represents a significant decrease from the 1950s when agriculture contributed to 58% of global emissions, a decrease largely due to the increased use of fossil fuels.
Population Growth and Emissions:
The global population has increased by 220% since 1950, leading to a threefold increase in agri-food emissions, now totaling 9-10 billion metric tons of CO2-equivalent annually.
Meat Production Growth:
Meat production has seen a 690% increase since 1950, driven by population growth, economic development, urbanization, technological advancements, and intensification of livestock production.
Technological improvements have significantly increased livestock yield, including higher carcass weights, improved feed efficiency, and greater output per animal.
Feed Conversion Ratio (FCR) as a Sustainability Metric:
FCR, which measures the efficiency of feed conversion into body mass, has improved dramatically for poultry, pigs, and cattle since the 1950s.
Improved FCR contributes to more efficient resource use, reduced environmental impact, better animal welfare, and economic viability.
Livestock Emissions and Land Use:
Livestock-related emissions have increased by 14% since 2000, with a significant portion coming from enteric fermentation in ruminants and land use changes.
Pasture and grazing land have expanded slightly, while the land for feed crops has increased substantially due to intensified livestock production.
Food Loss and Its Impact on Sustainability:
Food loss, occurring primarily before the consumer stage, remains stable at around 13%. Reducing food loss is critical for improving food security, economic efficiency, and minimizing the environmental footprint of livestock production.
Future Strategies for Sustainability:
The article emphasizes the need for ongoing investment in technology, optimization of feed efficiency, sustainable land use, and improved methods for tracking and reducing emissions to ensure the future sustainability of livestock farming.
As the global demand for animal products continues to rise, so do various claims about the impact of agriculture on greenhouse gas emissions. A study commissioned by the United Nations’ Food and Agriculture Organization (FAO) concluded that, according to the most recent data, agri-food system emissions totaled 16.5 billion metric tons of CO2 equivalent, representing 31% of global anthropogenic emissions.
Of these 31%, the most important trend highlighted by FAO was the “increasingly important role of food-related emissions generated outside of agricultural land, in pre- and post-production processes along food supply chains”. The food supply chain (food processing, packaging, transport, household consumption and waste disposal) is thus set to become the top GHG emitter, above farming and land use.
How bad is 31%?
While 31% is a large figure, even this estimate represents a significant decrease from the 1950s, when agri-food emissions constituted approximately 58% of total anthropogenic emissions: “From 1850 until around 1950, anthropogenic CO2 emissions were mainly (>50%) from land use, land-use change and forestry”, states the latest IPCC report.
Figure 1. Source: IPCC AR6 Report, 2023. LULUCF = Land Use, Land-Use Change and Forestry
As the IPCC graph in Figure 1 indicates, the percentage decrease is mostly due to the rising prevalence of oil and coal in CO2 emissions over the recent decades, as shown in Figure 2 below.
Annual greenhouse gas (GHG) emissions worldwide from 1990 to 2022, by sector (in million metric tons of carbon dioxide equivalent)
Total population and agri-food emission changes, 1950 – today
The global population increased by approximately 220%, from 2.5 billion in 1950 to 8 billion in 2023. In the meantime, estimates suggest that, in the 1950s, agri-food systems were responsible for approximately 2-3 billion metric tons of CO2-equivalent (CO2e) emissions per year. This figure includes emissions from livestock, rice paddies, fertilizer use, and land-use change (e.g., deforestation for agriculture).
Assessments generally agree that today’s agri-food systems contribute approximately 9-10 billion metric tons of CO2e annually, a threefold increase from 1950. This includes emissions from agriculture (e.g., livestock, crop production), food processing, transportation, and land-use changes.
This increase is consistent with FAO’s new findings, of food chain climbing to the top of agri-food emitters.
But where did these increased emissions come from?
A look at the graph below gives us an indication: world poverty rate decreased massively between 1950 and today. While COVID brought a setback, the historical data would clearly indicate a correlation between the increased output in agri-food systems and the decreased rate of poverty.
How did poverty rates decline so steeply? The reasons lie, to a large extent, in technological innovation, especially in genetics and farm management, and in the increased apport of plentiful and affordable meat protein to the world. The numbers below build an image of an industry that produces better, more, and cheaper.
Global meat production: 1950 vs. Present
Then…
In 1950, the estimated total meat production was of approximately 45 million metric tons.
Key Producers: The United States, Europe, and the Soviet Union were the primary producers of meat. Types of Meat: Production was largely dominated by beef and pork, with poultry being less significant.
…and now
Now, the total meat production lies somewhere around 357 million metric tons (as of recent data from FAO)., representing a 53% increase from 2000 and a staggering 690% increase from 1950.
Key Producers: Major producers include China, the United States, Brazil, and the European Union. Types of Meat: Significant increases in poultry production, with pork remaining a leading source of meat, especially in Asia. Beef production has also increased, but at a slower rate than poultry and pork.
Factors contributing to increased meat production
Population Growth: The world population has grown from approximately 2.5 billion in 1950 to over 8 billion today, driving increased demand for meat.
Economic Growth and Urbanization: Rising incomes and urbanization have led to shifts in economic power and dietary preferences, with more people consuming higher quantities of meat, especially in developing countries.
Technological Advancements: Improvements in animal breeding, feed efficiency, and production systems have increased the efficiency and output of meat production.
Intensification of Livestock Production: The shift from extensive to intensive livestock production systems has allowed for higher meat yields per animal.
Global Trade: Expansion of global trade in meat and meat products has facilitated the growth of production in countries with comparative advantages in livestock farming.
Livestock yield increase, 1950 to the present
The increase in livestock yield for cattle, pigs, and chickens between 1950 and the present has been significant due to advances in breeding, nutrition, management practices, and technology.
Beef
1950s
Average Carcass Weight: In the 1950s, the average carcass weight of beef cattle was about 200 to 250 kilograms (440 to 550 pounds).
Dressing Percentage: The dressing percentage (the proportion of live weight that becomes carcass) was typically around 50-55%.
Present Day
Average Carcass Weight: Today, the average carcass weight of beef cattle is approximately 300 to 400 kilograms (660 to 880 pounds).
Dressing Percentage: The dressing percentage has improved to about 60-65%.
Increase in Beef Cattle Yield
Increase in Carcass Weight: The average carcass weight has increased by about 100 to 150 kilograms (220 to 330 pounds) per animal.
Improved Dressing Percentage: The dressing percentage has increased by about 5-10 percentage points, meaning a greater proportion of the live weight is converted into meat.
Dairy
1950s
Average Milk Yield per Cow: Approximately 2,000 to 3,000 liters per year, depending on the region.
Present Day
Average Milk Yield per Cow: Approximately 8,000 to 10,000 liters per year globally, with some countries like the United States achieving even higher averages of 10,000 to 12,000 liters per year.
Increase in Milk Yield:: Milk yield per cow has increased about 4-5 times due to genetic selection, improved nutrition, technological advancements, and better herd management.
Chickens (Layers)
1950s
Average Egg Production per Hen: In the 1950s, a typical laying hen produced about 150 to 200 eggs per year.
Present Day
Average Egg Production per Hen: Today, a typical laying hen produces approximately 280 to 320 eggs per year, with some high-performing breeds producing even more.
Increase in Egg Yield: The average egg production per hen has increased by approximately 130 to 170 eggs per year.
Chickens (Broilers)
1950s
Average Yield per Bird: In the 1950s, broiler chickens typically reached a market weight of about 1.5 to 2 kilograms (3.3 to 4.4 pounds) over a growth period of 10 to 12 weeks.
Present Day
Average Yield per Bird: Today, broiler chickens reach a market weight of about 2.5 to 3 kilograms (5.5 to 6.6 pounds) in just 5 to 7 weeks.
Increase in Yield: The average weight of a broiler chicken has increased by approximately 1 to 1.5 kilograms (2.2 to 3.3 pounds) per bird. Additionally, the time to reach market weight has been nearly halved.
Factors contributing to yield increases
Genetic Improvement:
Selective Breeding: Focused breeding programs have developed chicken strains with rapid growth rates and high feed efficiency, significantly increasing meat yield.
Nutrition:
Optimized Feed: Advances in poultry nutrition have led to feed formulations that promote faster growth and better health, using balanced diets rich in energy, protein, and essential nutrients.
Management Practices:
Housing and Environment: Improved housing conditions, including temperature and humidity control, have reduced stress and disease, enhancing growth rates.
Technological Advancements:
Automation: Automation in feeding, watering, and waste management has improved efficiency and bird health.
Health Monitoring: Advances in health monitoring and veterinary care have reduced mortality rates and supported faster growth.
Feed Conversion Efficiency:
Improved Feed Conversion Ratios (FCR): The amount of feed required to produce a unit of meat has decreased significantly, making production more efficient.
Why Feed Conversion Ratio is a sustainability metric
Feed Conversion Ratio (FCR) is a critical metric in livestock production that measures the efficiency with which animals convert feed into body mass. It is expressed as the amount of feed required to produce a unit of meat, milk, or eggs. Advances in nutrition and precision feeding allow producers to tailor diets that optimize FCR, reducing waste and improving nutrient uptake. Also, breeding programs focused on improving FCR can lead to livestock that naturally convert feed more efficiently, supporting long-term sustainability.
Poultry (Broilers): From the 1950s, improved from approximately 4.75 kg/kg to 1.7 kg/kg.
Pigs: From the 1950s, improved from about 4.5 kg/kg to 2.75 kg/kg.
Cattle (Beef): From the 1950s, improved from around 7.5 kg/kg to 6.0 kg/kg.
Figure 4. Evolution of FCR from 1950
FCR is crucial for livestock sustainability for several reasons, as shown below.
1. Resource efficiency
– Feed Costs: Feed is one of the largest operational costs in livestock production. A lower FCR means less feed is needed to produce the same amount of animal product, reducing costs and improving profitability.
– Land Use: Efficient feed conversion reduces the demand for land needed to grow feed crops, helping to preserve natural ecosystems and decrease deforestation pressures.
– Water Use: Producing less feed per unit of animal product reduces the water needed for crop irrigation, which is crucial in regions facing water scarcity.
2. Environmental impact
– Greenhouse Gas Emissions: Livestock production is a significant source of greenhouse gases (GHGs), particularly methane from ruminants and nitrous oxide from manure management. Improved FCR means fewer animals are needed to meet production goals, reducing total emissions.
– Nutrient Runoff: Efficient feed use minimizes excess nutrients that can lead to water pollution through runoff and eutrophication of aquatic ecosystems.
3. Animal welfare
– Health and Growth: Optimizing FCR often involves improving animal health and growth rates, which can lead to better welfare outcomes. Healthy animals grow more efficiently and are less susceptible to disease.
4. Economic viability
– Competitiveness: Lowering FCR improves the economic viability of livestock operations by reducing input costs and increasing competitiveness in the global market.
– Food Security: Efficient livestock systems contribute to food security by maximizing the output of animal protein relative to the input of resources.
Improving FCR is essential for achieving sustainability in livestock production. It leads to more efficient resource use, reduced environmental impact, enhanced economic viability, and supports the well-being of animals. As global demand for animal products continues to rise, optimizing FCR will be crucial in balancing production with the need to protect and preserve natural resources.
“The eight warmest years on record since 1961 (and in fact since the beginning of observations in 1880) are all within the eight-year period of 2015–2022. Europe is the region where the temperature change has been the highest in 2022 (and also for most of the 2000–2022 period), with 2.23 °C, followed by Asia (1.75 °C), the Americas (1.05 °C), Africa (1.01 °C) and Oceania (0.8 °C). The average temperature change in the 2010s was 1.25 °C, compared to 0.96 °C in the 2000s.” FAOSTAT 2023
Livestock emissions
Livestock emissions can be direct (farm-gate) or indirect (land use). Pre- and post-production emissions are considered separately, since they refer to emissions from manufacturing, processing, packaging, transport, retail, household consumption, and waste disposal.
Global farm-gate emissions (related to the production of crops and livestock) grew by 14% between 2000 and 2021, to 7.8 Gt CO2 eq, see below. 53% come from livestock-related activities, and the emissions from enteric fermentation generated in the digestive system of ruminant livestock were alone responsible for 37 percent of agricultural emissions (FAOSTAT 2023).
Land use emissions contribute a large share to agricultural emissions overall, especially through deforestation (~74% of land-use GHG emissions). The numbers have declined in recent years, to a total of 21% reduction between 2000 and 2018.
The other side of the coin is represented by the increased land usage for livestock, either directly for grazing or indirectly for feed crops.
1. Pasture and grazing land
1950: Approximately 3.2 billion hectares (7.9 billion acres) were used as permanent pastures.
Present: The area has increased to around 3.5 billion hectares (8.6 billion acres).
Change: An increase of about 0.3 billion hectares (0.7 billion acres).
2. Land for Feed Crops
1950: The land area dedicated to growing feed crops (such as corn and soy) was significantly less than today due to lower livestock production intensities and smaller scale operations. Feed crops likely accounted for about 200-250 million hectares of the cropland, although figures are evidently difficult to estimate.
Present: Of the approx. 5 billion hectares of land globally used for agriculture, about 1.5 billion hectares are dedicated to cropland.
The increase in cropland hectares is a direct consequence of the intensification of demand for livestock production. To keep these numbers in check, it is essential that producers strive to use as little feed as possible for as much meat yield as possible – and this directly relates to a key metric of the feed additive industry: Feed Conversion Ratio, mentioned above.
The role of food loss in livestock sustainability
The Food and Agriculture Organization (FAO) of the United Nations definesfood loss as the decrease in quantity or quality of food resulting from decisions and actions by food suppliers in the chain, excluding retail, food service providers, and consumers. Food loss specifically refers to food that gets spilled, spoiled, or lost before it reaches the consumer stage, primarily taking place during production, post-harvest, processing, and distribution stages.
Food loss is currently estimated to be relatively stable over the last decades, at around 13%.
Key aspects of food loss
Stages of Food Loss:
Production: Losses that occur during agricultural production, including damage by pests or diseases and inefficiencies in harvesting techniques.
Post-Harvest Handling and Storage: Losses that happen due to inadequate storage facilities, poor handling practices, and lack of proper cooling or processing facilities.
Processing: Losses during the processing stage, which may include inefficient processing techniques, contamination, or mechanical damage.
Distribution: Losses that occur during transportation and distribution due to poor infrastructure, inadequate packaging, and logistical inefficiencies.
Quality and Quantity:
Quality Loss: Refers to the reduction in the quality of food, affecting its nutritional value, taste, or safety, which may not necessarily reduce its quantity.
Quantity Loss: Refers to the actual reduction in the amount of food available for consumption due to physical losses.
Exclusions:
Retail and Consumer Level: Food loss does not include food waste at the retail or consumer levels, which is categorized as food waste. Food waste refers to the discarding of food that is still fit for consumption by retailers or consumers.
Importance of reducing food loss
Every step along the production chain, each action taken to preserve feed, increase yield, ensure stable and high meat quality, can contribute to reducing food loss and ensuring that animal protein production stays sustainable and feeds the world more efficiently.
Food Security: Reducing food loss can help improve food availability and access, particularly in regions where food scarcity is a concern. Where we thought we were on our way to eradicate world hunger, recent upticks in several regions show us that progress is not a given.
Economic Efficiency: Minimizing food loss can improve the efficiency and profitability of food supply chains by maximizing the utilization of resources.
Environmental Impact: Reducing food loss helps to decrease the environmental footprint of food production by lowering greenhouse gas emissions and minimizing land and water use. This is all the more important in regions where world hunger shows signs of going up. Perhaps not by coincidence are these regions some of the most affected by climate change.
By understanding and addressing the causes of food loss, stakeholders across the food supply chain can work towards more sustainable and efficient food systems.
What’s next?
Improving production practices and technology
Investment in research and development of new technologies that enhance livestock production efficiency and reduce environmental impact is vital for the future sustainability of the sector.
India is a good illustration of room to grow. If we look at cow milk alone, India, with a headcount of approximately 61 million animals, has a total milk production that is neck-and-neck with the United States, whose dairy cow headcount is in the neighborhood of 9.3 million. India’s milk yield sits around 1,600 liters/animal/year, compared to the US’s average of 10,700 liters.
Continued focus on improving FCR through genetic selection, optimized nutrition, and advanced management practices will be crucial for reducing the environmental footprint of livestock production.
Promoting Sustainable Land Use
Strategies to balance the need for increased livestock production with sustainable land use practices are essential. This includes adopting agroecological approaches and improving the efficiency of feed crop production.
Reducing Food Loss
Stakeholders across the food supply chain must prioritize reducing food loss through improved storage, transportation, and processing technologies. This will help ensure that livestock production contributes effectively to global food security.
Enhancing Emission Tracking and Reporting
There is a need for standardized methods for collecting and reporting data on GHG emissions in agriculture. This will enable more accurate assessments and the development of targeted strategies for emission reductions.
References
Bell, D. D. (2002). Laying hens in the U.S. market: An appraisal of trends from the beginning of the 20th century to present. Poultry Science, 81(5), 485-490. https://doi.org/10.1093/ps/81.5.485
Crippa, M., Solazzo, E., Guizzardi, D., Monforti-Ferrario, F., Tubiello, F. N., Leip, A., … & Janssens-Maenhout, G. (2022). Greenhouse gas emissions from food systems: building the global food system emissions database (GFED). Earth System Science Data, 14(4), 1795-1821. https://essd.copernicus.org/articles/14/1795/2022/essd-14-1795-2022.pdf
Goldewijk, K. K., & Verburg, P. H. (2013). Per-capita estimations of long-term historical land use and the consequences for global change research. Global Environmental Change, 23(4), 1166-1175. https://doi.org/10.1016/j.gloenvcha.2013.04.001
Kusuma, A. B., Laga, W. R., & Purnomo, H. (2022). Climate Change and Livestock Farming: Strategies for Mitigation and Adaptation. MDPI, 12(10), 1554. https://www.mdpi.com/2077-0472/12/10/1554
Roche, J. R., Friggens, N. C., Kay, J. K., Fisher, M. W., Stafford, K. J., & Berry, D. P. (2013). Invited review: Body condition score and its association with dairy cow productivity, health, and welfare. Animal Frontiers, 3(4), 23-29. https://doi.org/10.2527/af.2013-0032
Thornton, P. K., & Herrero, M. (2015). Impacts of climate change on the livestock food supply chain; a review of the evidence. Frontiers in Veterinary Science, 2, 93. https://www.ncbi.nlm.nih.gov/pmc/articles/PMC4686767/
Zuidhof, M. J., Schneider, B. L., Carney, V. L., Korver, D. R., & Robinson, F. E. (2014). Evolution of the modern broiler and feed efficiency. Annual Review of Animal Biosciences, 2(1), 47-71. https://doi.org/10.1146/annurev-animal-022513-114132
Ketosis: the most critical metabolic disease in dairy cows
Judith Schmidt, Product Manager On-Farm Solutions
Improvements in genetics, nutrition, and management continue to enhance dairy cows’ performance. However, being high-performance athletes comes at a cost, putting an extremely high burden on the animals’ energy metabolism. Especially around calving and during the first eight weeks of lactation, dairy cows can experience many stress factors: subclinical hypocalcemia, abomasum displacements, herd composition changes, or lameness. The more stress factors put the cows’ organism under pressure, the more likely they will become sick. A common consequence of stress is the occurrence of metabolic diseases, especially ketosis.
Both in terms of animal health and economic aspects, ketosis is probably the most critical dairy cow disease when also considering the correlated diseases. In this article, we explore the causes and consequences of ketosis and highlight prevention strategies that keep this issue under control.
Ketosis: causes and consequences
How ketosis develops
A restricted feed intake capacity and/or reduced energy concentration in the ration lead to a deficit in the animal’s energy balance. This situation occurs, for instance, at calving when the mother animal focuses her resources on the calf and its care. To compensate for the energy deficit, body fat is broken down for energy production. This process creates free fatty acids that accumulate in the liver and are partially converted into ketone bodies. These ketone bodies are a “transport medium” for energy, which various organs can use as an alternative energy source.
The problem arises when the deficiency lasts too long: more and more body fat is broken down, more and more fatty acids reach the liver, which leads to a fatty liver, and too high an amount of ketone bodies is formed and released into the blood. The ketone bodies in the blood inhibit appetite, resulting in less feed consumption and an energy deficit – the vicious cycle of ketosis begins.
Subclinical ketosis
Subclinical ketosis is defined as the stage of the disease at which an increased level of ketone bodies can be detected in the blood, urine, and milk. Furthermore, signs of hypoglycemia, increased levels of non-esterified fatty acid, and decreased hepatic gluconeogenesis can be seen in the blood. These conditions are typically not detected because there are no clinical signs.
Subclinical ketosis is a problem as it does not cause visible symptoms but leads to an increased incidence of subsequent diseases such as lab stomach displacement, clinical ketosis, and uterine inflammation. In addition, there may be loss of milk and fertility problems. Subclinically ill animals cannot be identified by the farmer by observation alone. Therefore, subclinical ketosis must be detected at an early stage to be able to act at the right time: prophylaxis instead of therapy.
There are several test possibilities to find out if an animal suffers from ketosis:
Milk: Milk test for ketosis detection has been available for many years. The results are to be obtained based on a color gamut. In contrast to blood analysis, the milk test does not evaluate exact values but shows a color change of the contained indicator. However, an increased milk cell content of the feeding of poorly fermented silages with a high butyric acid content significantly influences the result. The test often does not adequately reflect the actual conditions.
Urine: Another possibility is the examination of urine samples. Urine can be obtained spontaneously or with the help of a catheter. The results can also be read on a color scale of the urine test stripes. Like the milk test, the urine test only distinguishes different concentration ranges, but these are more finely graded than in the milk tests.
Blood: The most accurate but also most complex and expensive method is a blood test. It has the advantage that not only ketone bodies but also other parameters such as free fatty acids, minerals, and liver enzymes can be analyzed. In addition, the blood analysis results are evaluated in numbers and are more comparable than the color changes of test stripes. A good alternative is a rapid test by using a rapid test device, which is also used for measuring human blood sugar. A result is displayed with a drop of blood on a test strip within a few seconds.
Clinical ketosis
Depending on why there are elevated ketone body levels in the blood, we distinguish between primary and secondary clinical ketosis. For the primary form of clinical ketosis, the energy deficit itself (due to high performance and/or incorrect feeding) causes the condition. This form mainly occurs in susceptible, high-yielding dairy cows between the second and seventh weeks of lactation (Vicente et al., 2014). Secondary ketosis is caused indirectly by other diseases disease. A cow suffering from, for example, a claw disease might no longer consume a performance-based feed ration, leading to an energy deficit.
Typical symptoms
Typical of metabolic diseases, ketosis leads to a broad spectrum of symptoms. The classic symptoms at the beginning of the disease are a loss of appetite and decreased milk performance. As the disease develops, motor skills may be affected, and the excrement’s consistency becomes firmer and darker in color. The respiratory rate of sick animals increases, and they show dyspnea. Dyspnea is the medical description for breathing difficulties. Affected animals suffer from air shortage, which can occur in different situations. Due to the excretion of ketone bodies via the mucous membranes, the animals’ breath smells more or less strongly of acetone (Robinson and Williamson, 1977).
In addition, the animals undergo rapid and severe weight loss, and their general body conditions deteriorate noticeably. Furthermore, cows suffering from ketosis show increased milk fat content or an increased milk fat/protein quotient. Clinical symptoms include reduced general well-being, apathy, blindness, staggering, persistent “absent-minded” licking of the environment or overexcitability, muscle tremors, and aggressiveness (Andersson, 1984).
Effects on animal health and performance
Even in its subclinical form – if untreated – ketosis will engender health risks and reduced performance, negatively impacting milk yield and cows’ fertility. For clinical cases, typical effects include infertility, udder and hoof problems, and a fatty liver. Ketosis during early lactation is usually associated with fatty liver disease. In severe cases, the liver becomes enlarged and more fragile. It then no longer performs its detoxification function, toxic compounds increase, and the central nervous system is damaged. Anorexia or even a total loss of consciousness, the so-called hepatic coma, might ensue, ending in a complete liver function failure.
Direct economic costs range from high veterinary costs to the total loss of the dairy cow, i.e., approximately € 600 to € 1.000 per cow. Moreover, producers face indirect costs from secondary diseases such as fatty liver disease, increased postpartum behavior such as uterine infections, abomasum dislocations, or claw diseases.
Ketosis prevention: feeding and targeted supplementation
Feeding strategy
As part of the preparatory feeding, both dry and pregnant cows should receive rations that lead to an optimal (and not maximum) body condition at the time of calving. Animals with a poorer nutritional status do not have enough body fat reserves to compensate for lack of energy in the first phase of lactation. In more cases, animals have a too high BCS, leading to a risk of difficult births, and the cows have too little appetite at the beginning of lactation. These cows tend to show an excessive mobilization of fat reserves and develop a fatty liver. So prevention of ketosis of the current lactation starts with preventing a too-high BCS in the middle of the previous lactation.
The aim of feeding measures is to keep the lactating cow’s discrepancy between nutrient requirements and nutrient uptake as low as possible when the genetically determined performance potential is exhausted. For this reason, the ration must have a certain minimum energy density (high-quality forage and appropriate concentrate supplements). Also, anything that prevents the cows from ingesting the maximum amount of dry matter should be avoided.
Ket-o-Vital bolus for metabolic support
Another important preventive measure is the specific support of the calving cow’s liver, rumen, and immune system. EW Nutrition’s Ket-o-Vital Bolus was explicitly designed to reduce the risk of ketosis. It contains fast-available glucogenic substances, positively influencing the cow’s energy metabolism. Another advantage the bolus offers is the slow release of the contained cobalt, selenium, niacin, and active yeast:
Cobalt is a trace element important to form cobalamin, the so-called vitamin B12. It is essential for blood formation and the functioning of the nervous system.
Selenium protects cells from oxidative damage and ensures an intact immune defense;
Niacin is a B vitamin that intervenes in energy metabolism and prevents fatty liver syndrome;
And active yeast supports rumen health, preventing rumen acidosis and increasing feed intake.
The application of the Ket-o-Vital Bolus is profitable and straightforward. Only one bolus per application is required.
Ketosis control: be one step ahead
High-performance dairy cows are at risk of ketosis, which results in involuntary culling, poor health, and performance losses. Advanced feed management practices combined with the targeted use of the Ket-o-Vital bolus offer a solution for preventing this debilitating disease. The bolus protects the cows from clinical and subclinical ketosis, reduces metabolic disorders, increases appetite, and improves health – leading to a quick recovery and ensuring profitable production.
References
Vicente, Fernando, María Luisa Rodríguez, Adela Martínez-Fernández, Ana Soldado, Alejandro Argamentería, Mario Peláez, and Begoña de la Roza-Delgado. “Subclinical ketosis on dairy cows in transition period in farms with contrasting butyric acid contents in silages.” The Scientific World Journal 2014 (November 25, 2014): 1–4. https://doi.org/10.1155/2014/279614.
Andersson, L. “Concentrations of blood and milk ketone bodies, blood isopropanol and plasma glucose in dairy cows in relation to the degree of hyperketonaemia and clinical signs*.” Zentralblatt für Veterinärmedizin Reihe A 31, no. 1-10 (1984): 683–93. https://doi.org/10.1111/j.1439-0442.1984.tb01327.x.
Robinson, A. M., and D. H. Williamson. “Effects of acetoacetate administration on glucose metabolism in mammary gland of fed lactating rats.” Biochemical Journal 164, no. 3 (1977): 749–52. https://doi.org/10.1042/bj1640749.
Masked mycotoxins – particularly dangerous for dairy cows
By Si-Trung Tran, SEAP Regional Technical Manager, EW Nutrition
Technical Team and Dr. Inge Heinzl, Editor, EW Nutrition
Mycotoxins are secondary metabolites of fungi, commonly found as contaminants in agricultural products. In some cases, these compounds are used in medicine or industry, such as penicillin and patulin. In most cases, however, they are considered xenobiotics that are toxic to animals and humans, causing the disease collectively known as mycotoxicosis. The adverse effects of mycotoxins on human and animal health have been documented in many publications. Aflatoxins (AFs) and deoxynivalenol (DON, vomitoxin) are amongst the most critical mycotoxins affecting milk production and -quality.
Aflatoxins do not only affect cows
Aflatoxins (AFs) are highly oxygenated, heterocyclic difuranocoumarin compounds produced by Aspergillus flavus and Aspergillus parasiticus. They colonize crops, including many staple foods and feed ingredients. Within a group of over 20 AFs and derivatives, aflatoxin B1 (AFB1), B2, G1, and G2 are the most important naturally occurring compounds.
Among the aflatoxins, AFB1 is the most widespread and most toxic to humans and animals. Concern about mycotoxin contamination in dairy products began in the 1960s with the first reported cases of contamination by aflatoxin M1 (AFM1), a metabolite of AFB1 formed in the liver of animals and excreted in the milk.
There is ample evidence that lactating cows exhibit a significant reduction in feed efficiency and milk yield within a few days of consuming aflatoxin-contaminated feed. At the cellular level, aflatoxins cause degranulation of endoplasmic membranes, loss of ribosomes from the endoplasmic reticulum, loss of nuclear chromatin material, and altered nuclear shapes. The liver, as the organ mainly dealing with the decontamination of the organism, gets damaged, and performance drops. Immune cells are also affected, reducing immune competence and vaccination success (Arnold and Gaskill, 2023).
DON reduces cows’ performance
Another mycotoxin that can also reduce milk quality and affect metabolic parameters, as well as the immune function of dairy cows, is DON. DON is produced by different fungi of the Fusarium genus that infect plants. DON synthesis is associated with rainy weather from crop flowering to harvest. Whitlow and co-workers (1994) reported the association between DON and poor performance in dairy herds and showed decreased milk production in dairy cows fed 2.5 mg DON/kg. However, in cows fed 6 to 12 mg DON/kg dry matter for 10 weeks, no DON or its metabolite DOM-1 residues were detected in milk.
Masked mycotoxins hide themselves during analysis
Plants suffering from fungal infestations and thus confronted with mycotoxins convert the harmful forms of mycotoxins into less harmful or harmless ones for themselves by conjugation to sulfates, organic acids, or sugars. Conjugated mycotoxins cannot always be detected by standard analytical methods. However, in animals, these forms can be released and transformed into parent compounds by enzymes and microorganisms in the gastrointestinal tract. Thus, the feed may show a concentration of mycotoxins that is still below the limit value, but in the animal, this concentration is suddenly much higher. In dairy cows, the release of free mycotoxins from conjugates during digestion may play an important role in understanding the silent effects of mycotoxins.
Fusarium toxins, in particular, frequently occur in this “masked form”. They represent a serious health risk for animals and humans.
Aflatoxins first show up in the milk
Masked aflatoxins may also play a role in total aflatoxin contamination of feed materials. Research has harvested little information on masked aflatoxins that may be present in TMR ingredients. So far, metabolites such as Aflatoxin M2 have been identified (Righetti, 2021), which may reappear later in milk as AFM1.
DON-related symptoms without DON?
Sometimes, animals show DON-related symptoms, with low levels detected in the feed or raw materials. Besides sampling errors, this enigma could be due to conjugated or masked DON, which is structurally altered DON bound to various compounds such as glucose, fatty acids, and amino acids. These compounds escape conventional feed analysis techniques because of their modified chemical properties but can be released as their toxic precursors after acid hydrolysis.
Masked DON was first described in 1984 by Young and co-workers, who found that the DON content of yeast-fermented foods was higher than that of the contaminated wheat flour used in their production. The most plausible reason for this apparent increase was that the toxin from the wheat had been converted to a compound other than DON, which could be converted back to DON under certain conditions. Since this report, there has been much interest in conjugated or masked DON.
Silage: masked DON is a challenge for dairy producers
Silage is an essential feed for dairy cows, supporting milk production. Most silage is made from corn and other grains. The whole green plant is used, which can be infected by fungi. Since infection of corn with Fusarium spp. and subsequent DON contamination is usually a major problem in the field worldwide, a relatively high occurrence of this toxin in silage must be expected. The ensiling process may reduce the amount of Fusarium fungi, but the DON formed before ensiling is very stable.
Silage samples show DON levels of concern
It is reasonable to assume that the DON biosynthesized by the fungi was metabolized by the plants to a new compound and thus masked DON. Under ensiling conditions, masked DON can be hydrolyzed, producing free DON again. Therefore, the level of free DON in the silage may not reflect the concentration measured in the plants before ensiling.
A study analyzed 50 silage samples from different farms in Ontario, Canada. Free DON was found in all samples, with levels ranging from 0.38 to 1.72 µg/g silage (unpublished data). Eighty-six percent of the samples contained DON at concentrations higher than 0.5 µg/g. Together with masked DON, it poses a potential threat to dairy cattle.
Specific hydrolysis conditions allow detection
However, in the natural ensiling process, the conditions for hydrolysis of masked DON are not optimal. The conditions that allow improved analysis of masked DON were recently described. This method detected masked DON in 32 of 50 silage samples (64%) along with free DON, increasing DON concentration by 23% in some cases (unpublished data).
Mycotoxins impact humans and animals
Aflatoxins, as well as DON, have adverse effects. In the case of DON, the impact on the animal is significant; in the case of aflatoxin, the possible long-term effects on humans are of higher relevance.
DON has more adverse effects on the animal and its performance
Unlike AFs, DON may be found in milk at low or trace concentrations. It is more associated with negative effects in the animal, altered rumen fermentation, and reduced flow of usable protein into the duodenum. For example, milk fat content was significantly reduced when cows were fed 6 µg DON/kg. However, the presence of DON also indicates that the feed probably contains other mycotoxins, such as zearalenone (ZEA) (estrogenic mycotoxin) and fusaric acid (pharmacologically active compound). All these mycotoxins may interact to cause symptoms that are different or more severe than expected, considering their individual effects. DON and related compounds also have immunosuppressive effects, resulting in increased somatic cell counts in milk. The U.S. FDA has established an action level for DON in wheat and wheat-derived products intended for cows, which is 5µg DON/g feed and the contaminated ingredient must not exceed 40% of the ration.
Aflatoxins decrease milk quality and pose a risk to humans
Aflatoxins are poorly degraded in the rumen, with aflatoxicol being the main metabolite that can be reconverted to AFB1. Most AFs are absorbed and extensively metabolized/hydrolyzed by enzymes found mainly in the liver. This results in the formation of AFM1, a part of which is conjugated to glucuronic acid and subsequently excreted in the bile. The other part enters the systemic circulation. It is either excreted in urine or milk. AFM1 appears within 12-48 hours after ingestion in cow’s milk. The excreted amount of AFM1 in milk from dairy cows usually ranges from 0.17% to 3% of the ingested AFB1. However, this carryover rate may vary from day to day and from one milking to the next in individual animals, as it is influenced by various factors, such as feeding regime, health status, individual biotransformation capacity, and, of course, by actual milk production. Carryover rates of up to 6.2% have been reported in high-yielding dairy cows producing up to 40 liters of milk per day.
In various experiments, AFM1 showed both carcinogenic and immunosuppressive effects. Accordingly, the International Agency for Research on Cancer (IARC) classified AFM1 as being in Group 2B and, thus, possibly carcinogenic in humans. The action level of 0.50 ppb and 0.05 ppb for AFM1 in milk is strictly adhered to by the U.S. Food and Drug Administration (FDA) and the European Food Safety Authority (EFSA), respectively.
Trials show the high adsorption capacity of Solis Max
A trial was conducted at an independent laboratory located in Spain. The evaluation of the performance of Solis Max was executed with the following inclusion levels:
0.10% equivalent to 1.0 kg of Solis Max per ton of feed
0.20% equivalent to 2.0 kg of Solis Max per ton of feed
A phosphate buffer solution at pH 7 was prepared for the trial to simulate rumen conditions. Each mycotoxin was tested separately, preparing solutions with known contamination (final concentration described in the table below). The contaminated solutions were divided into 3 parts: A positive control, 0.10% Solis Max and 0.20% Solis Max. All samples were incubated at 41°C for 1 hour, centrifuged, and the supernatant was analyzed for the mycotoxin added to determine the binding efficacy. All analyses were carried out by high-performance liquid chromatography (HPLC) with standard detectors.
Mycotoxin
Contamination Level (ppb)
Aflatoxin B1
800
DON
800
Fumonisin B1
2000
ZEA
1200
Results: The higher concentration of Solis max showed a higher adsorption rate for most mycotoxins. The high dose of Solis Max adsorbed 99% of the AFB1 contamination. In the case of DON, more than 70% was bound. For fumonisin B1 and zearalenone, Solis max showed excellent binding rates of 87.7% and 78.9%, respectively (Figure 1).
Figure 1: Solis Max showed a high binding capacity for the most relevant mycotoxins
Another trial was conducted at an independent laboratory serving the food and feed industry and located in Valladolid, Spain.
All tests were carried out as duplicates and using a standard liquid chromatography/mass spectrometry (LC/MS/MS) quantification. Interpretation and data analysis were carried out with the corresponding software. The used pH was 3.0, toxin concentrations and anti-mycotoxin agent application rates were set as follows (Table 1):
Table 1: Trial set-up testing the binding capacity of Solis Plus 2.0 for several mycotoxins in different contamination levels
Results:
Under acidic conditions (pH3), Solis Plus 2.0 effectively adsorbs the three tested mycotoxins at low and high levels. 100% binding of aflatoxin was achieved at a level of 150ppb and 98% at 1500ppb.In the case of fumonisin, 87% adsorption could be reached at 500ppb and 86 for a challenge with 5000ppb. 43% ochratoxin was adsorbed at the contamination level of 150ppb and 52% at 1500ppb.
Figure 2: The adsorption capacity of Solis Plus 2.0 for three different mycotoxins at two challenge levels
Mycotoxins – Effective risk management is of paramount importance
Although the rumen microflora may be responsible for conferring some mycotoxin resistance to ruminants compared to monogastric animals, there are still effects of mycotoxins on rumen fermentation and milk quality. In addition, masked mycotoxins in feed present an additional challenge for dairy farms because they are not readily detectable by standard analyses.
Feeding dairy cows with feed contaminated with mycotoxins can lead to a reduction in milk production. Milk quality may also deteriorate due to an adverse change in milk composition and mycotoxin residues, threatening the innocuousness of dairy products. Dairy farmers should therefore have feed tested regularly, consider masked mycotoxins, and take action. EW Nutrition’s MasterRisk tool provides a risk evaluation and corresponding recommendations for the use of products that mitigate the effects of mycotoxin contamination and, in the end, guarantee the safety of all of us.
4 steps to improve dairy cow fertility through feeding
By Judith Schmidt, Product Manager On Farm Solutions
The average pregnancy rate for dairy cows has declined over the past decades. But why is my cow not getting pregnant? Is it because of feeding? These are questions we ask ourselves when things do not quite work out with the offspring in the cowshed. Economic success in the cow barn is closely related to the successful reproduction of our cattle herd.
The maintenance and possible improvement of fertility are becoming increasingly important issues for farm productivity. Infertility is still one of the main reasons for culling on dairy farms. When farmers decide to cull a cow after a few unsuccessful inseminations, they often ask themselves whether this could not have been prevented. There is no “all-encompassing” solution for achieving an optimal fertility rate, which ultimately requires excellent management. Relevant factors include oestrus monitoring and insemination timing, genetic conditions, feeding, hygiene, and climate.
How can I tell if a cow is in heat?
A cow behaves differently than usual during oestrus. She is restless and walks around more. A cow in heat stands next to other cows – head to tail. Sie also quarrels with her herd mates or sniffs at the shame of the other cows. Fertility in cows decreases during late winter and spring; the resulting absence of clear signs of oestrus makes it difficult to recognize the right time for insemination. There are several possible causes which will be reviewed below.
Possible causes of fertility problems in dairy cows
Beta-carotene deficiency
A productive herd needs to receive an optimal mineral and trace element supply. Beta-carotene, in particular, is essential for herd fertility. But why?
Beta-carotene is an orange-yellow plant pigment whose name comes from “carrot” because of its appearance. It is also a precursor of vitamin A. Both as a precursor and as vitamin A itself, it is essential for the organism of humans and animals, particularly when it comes to the fertility of dairy cows. Besides its important function as provitamin A, beta-carotene also exerts an independent effect on the ovary. It influences the quality of the follicle and the corpus luteum. Beta-carotene also protects the corpus luteum. It promotes the synthesis of the pregnancy hormone progesterone and thus enables the fertilized egg to implant successfully in the uterine lining.
A beta-carotene deficiency can lead to the following problems:
Smaller, not fully functional follicles
Altered oestrus intervals
Indistinct signs of oestrus
Decreased corpus luteum quality
Scientific trials show how much a beta-carotene deficiency influences the fertility process. With a beta-carotene deficiency, the fertilization rate after the first insemination is only 40%, whereas with a normal beta-carotene supply, the fertilization rate is about 70%.
How do I know if my herd is deficient in beta-carotene?
The easiest way is to check the color of the fresh colostrum. If it is a deep yellow to an even orange, the cows are supplied with sufficient beta-carotene. If it looks more ivory, this is a sign of a deficiency. Of course, a poor herd fertilization rate can also indicate a deficiency. If you suspect a beta-carotene deficiency, it is best to test some blood samples from your animal or use a testing device such as a carotene photometer. With such a test kit, you can determine not only the levels in the blood but also in the colostrum and the milk.
Feeding deficiencies
Feeding plays a major role in fertility issues. Too low input rates often have a negative effect on the health of cows. Feed quality and herd management have an impact on how long the cow loses weight after calving and at what point she gains weight again. One must always keep in mind the cows’ feeding, energy balance, and nutrient supply because cows with a negative energy balance often do not show oestrus. It is also important that the silage is of high quality – poor silage inhibits fertility.
Follicle quality
The quality of the follicle is crucial for good fertility. The quality is influenced by the energy supply during the dry period and lactation during the first days. Since the follicles are already formed in the last days of gestation, a lack of energy during this period means that the maturation of the follicles – even with a better supply later on – can no longer proceed optimally and is ultimately inferior. This inevitably leads to a reduction of oestrus symptoms and minimizes the chances of successful insemination.
Prevention is key: 4 steps to improve fertility through feeding
1) Avoid stress in the feeding environment
Well-being and a high feed intake are the basis for high milk and fattening yields as well as healthy and fertile animals. Dry cows and transit cows particularly should only experience low stress. This means no overcrowding and generous feeding space, i.e., each animal should have its own feeding space. Feeding areas that are too narrow prevent the animals from eating, rank fights occur, and feed intake decreases.
Freshly lactating cows should be separated from the group. If the cows are in calving pens or calving stables, they should always have visual contact with the herd.
2) Optimize feed quality and rations
Feed quality and feeding management determine how long the cow loses weight after calving (negative energy balance) and at what point the cow gains weight again (positive energy balance). Optimal fertility performance can only happen when a positive energy balance is achieved.
The cow’s fertility performance is primarily determined by nutrient supply and feeding. At the beginning of the lactation, high-quality basic feed with a high energy concentration should be fed, as feed intake is slow to get going after calving. Nevertheless, this ration should have sufficient structure. The amounts of concentrate should be divided into several individual portions and carefully increased. For high feed intakes, fresh water should be constantly available to the animals.
3) Treat diseases early to enable feeding
Diseases that lead to a reduced appetite should be treated as early as possible. In particular, attention should be paid to healthy hooves because a cow that has pain or difficulty getting up and walking is much less likely to go to the feed table.
4) Supplement vitamins, minerals, and trace elements
The needs-based supply of vitamins, minerals, and trace elements in every performance phase is a decisive success factor for good herd fertility. A sufficient supply of trace elements, especially selenium, manganese, zinc, as well as vitamin A and beta-carotene, are important for the formation of fertility hormones and optimal insemination success. At the same time, they ensure a high colostrum quality.
EW Nutrition’s Fertilgol Bolus is a long-term bolus to support fertility. The high content of beta-carotene has a positive influence on the formation of the corpus luteum, the oestrus cycle, the quality of colostrum and sperm. The release rate of the ingredients beta-carotene, selenium, vitamin A, and other trace elements takes place over at least twenty days. Fertilgol Bolus can be used for female and male breeding animals shortly before and during the breeding or insemination period.
How to reduce methane emissions in dairy cows: phytogenic solutions
by Technical Team, EW Nutrition
The world demand for milk has seen a sharp rise. Today, we have just over 1 billion dairy cows in the world producing about 1.6 billion tons of milk per year. However, OECD and FAO estimate that numbers will rise up to 1.5 billion dairy cows in 2028, for a total milk production of 2 billion tons . This increase will come at a tremendous cost in terms of global warming: Each day, dairy cows can produce 250 to 500 litres of methane, a powerful greenhouse gas (Johnson and Johnson, 1995).
Climate change is not the only reason for zootechnical production to adopt methane reduction strategies. Methane emissions represent an important energy loss for dairy cows, which negatively impacts production performance. In this article, we review why methanogenesis in dairy cows arises, and how the use of phytogenic product Activo Premium can help achieve efficient energy use and reduced climate impact.
Less methane: environmental, regulatory, and business pressures
Methane (CH4) is considered one of the gases that, together with CO2 (carbon dioxide) and N2O (nitrous oxide), traps heat in the atmosphere and, thus, causes global warming. While methane is generated in multiple industries, including the energy and waste sectors, much of the methane present in the atmosphere derives from livestock activities and, in particular, from ruminant farms.
About 28% of total methane emissions derive from agriculture sector and enteric fermentations (digestive processes in which feed is broken down by microorganisms) are responsible for about 65% of the total methane coming from zootechnical sector (Knapp et al., 2014). For this reason, in recent years, strategies for mitigating methane emissions in dairy cows have aroused great interest among researchers and environmentally-conscious consumers.
Regulators have also caught on: In October 2020, the European Commission presented its strategy for reducing methane emissions in Europe. Reductions are essential to achieve the Commission’s climate objectives for 2030 and climate neutrality by 2050. For the livestock sector, the Commission seeks to develop an inventory of innovative mitigating practices by the end of 2021, with a special focus on methane from enteric fermentation.
Uptake of mitigation technologies will be promoted though Member States’ and the Common Agricultural Policy’s “carbon farming” measures. Carbon-balance calculations at farm level are to be encouraged through digital tools; and the Horizon Europe strategic plan 2021-2024 will likely include targeted research on effective reduction strategies, focusing on technology, dietary factors, and nature-based solutions such as phytogenic products.
Even aside from environmental concerns, consumers demands, and regulatory steps, there is a critical business case for dairy producers to lower methane emissions. Given the ever-increasing global demand for dairy products, farmers and other operators in the sector more than ever try to maintain and indeed improve production to maximize yields, both economically and in terms of finished products. Problematically, methane production in the rumen represents a great loss of energy for the animal.
On average, about 6% of the total energy ingested by a dairy cow is transformed into methane, every single day (Succi and Hoffmann, 1993). The less methane a cow produces, the more metabolizable energy (ME) she gets out of her gross energy (GE) intake. A better ME/GE ratio translates into higher net energy of lactation (NEl). Energy losses from methanogenesis thus directly decrease the energy nutritionist can consider as usable during rationing.
Before we review the current research on how an adequate manipulation of the diet and of the rumen environment can mitigate these energy losses, we need to ask ourselves, why is methane formed in the rumen at all?
Animal physiology: how methane is formed in the rumen
Ruminants’ digestion of vegetal ingredients is linked to their rumen’s symbiotic bacterial, protozoan, and fungal flora. This microbiota has all the enzymatic properties necessary for the digestion (or rather pre-digestion) of ingested forage, including some cellulose fractions that monogastric animals cannot use.
In the rumen, the main products deriving from bacterial fermentation are volatile fatty acids and methane. The main volatile fatty acids are acetic acid, propionic and butyric acid, which are mainly absorbed and used by the animal. Meanwhile, methane helps to maintain the oxidative conditions in the rumen’ anaerobic environment, but also represents an energy loss (Czerkawski, 1988).
Methanogenesis is carried out by methanogenic bacteria and archae in the rumen (Guglielmelli, 2009). They use molecular hydrogen and carbon dioxide as a substrate for the synthesis of methane, according to the following equation:
4 H2 + CO2 → CH4 + 2 H2O
A few other chemical reactions contribute to methanogenesis, but they all have one thing in common: they require hydrogen ions in the rumen fluid to form methane from CO2. This gives us the first “point of attack” for reducing methane formation: the diet.
Increase the share of propionic acid
Propionic acid is in competition with methanogens in using hydrogen ions to reduce glucose molecules:
It is clear that if propionic fermentations are stimulated through the diet at the expense of the pathways leading to acetate and butyrate (where hydrogen ions are transferred to the rumen environment), the availability of hydrogen for the reduction of CO2 by methanogenic bacteria decreases.
Diets with a high level of concentrates, and low levels of neutral detergent fibre, yield more propionic acid and less acetic and butyric acid. Set aside lower methane emissions, this increase in energy is desirable during peak lactation: the energy gap that follows from the decrease in ingestion by the animal requires diets with a high amount of substrate for gluconeogenesis. Furthermore, the greater production of propionate sequesters H2 in the rumen environment and, consequently, less CO2 is reduced to methane.
Optimize the protozoa count
Most methane-producing bacteria live in symbiosis with most of the protozoan species, they are located on the surface of the protozoan. It follows that optimizing the population of protozoa present in the rumen (through dietary measures) leads to a lower methanogenesis (Patra and Saxena, 2010). Naturally, a minimum amount of protozoa must be maintained to avoid excessively reducing ruminal motility (regular contractions that mix and move the rumen content), which is important for feed digestibility.
Diet is not enough: feed additives to reduce methane production
Dietary measures alone cannot considerably reduce daily methane production. In the past, antibiotic growth promoters belonging to the ionophores family were commonly administered in the EU. These antibiotics increase efficiency and daily weight gain by promoting gluconeogenesis through greater production of propionic acid in the rumen and a consequent reduction in emitted methane (Piva et al., 2014).
The emergence of bacterial forms resistant to growth-promoting antibiotics have forced the EU to ban these molecules to safeguard consumer health. Fortunately, certain feed additives can also help reduce methanogenesis and generate energy saving – without the danger of resistance.
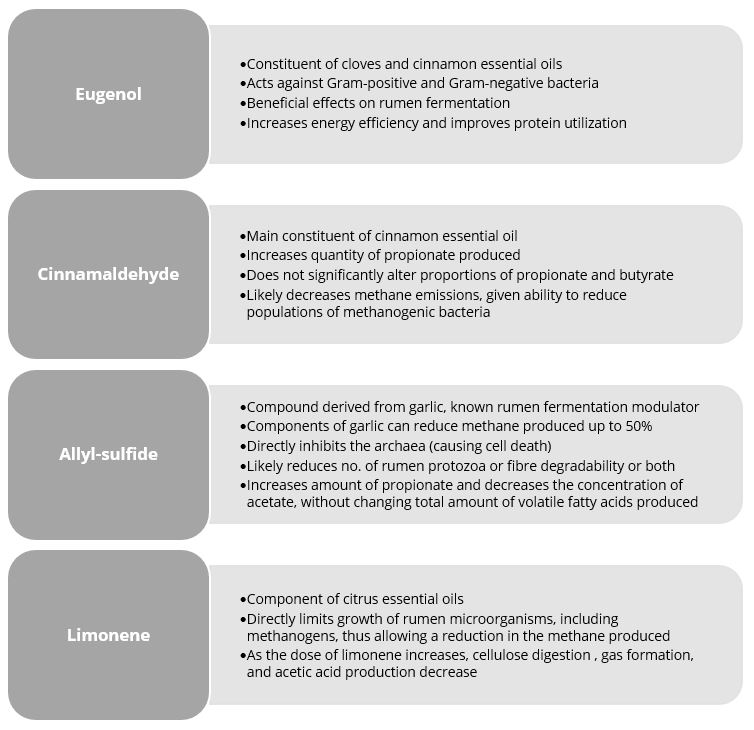
Secondary plant extracts or phytomolecules feature relevant properties, including bactericidal, virucide, and fungicide effects. As we have seen, it is critical to encourage certain fermentations at the expense of others and possibly reduce the organisms directly and indirectly responsible (bacteria and protozoa) for methanogenic fermentations.
Activo Premium: reduce methane and preserve energy
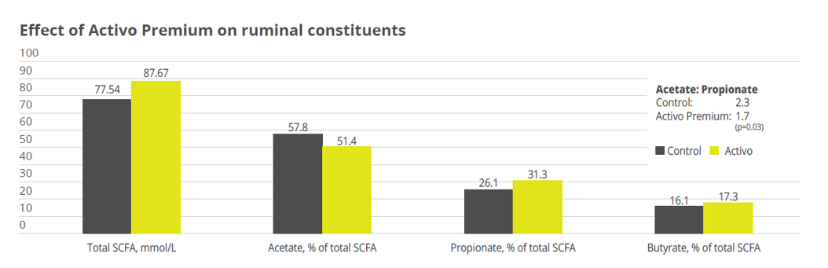
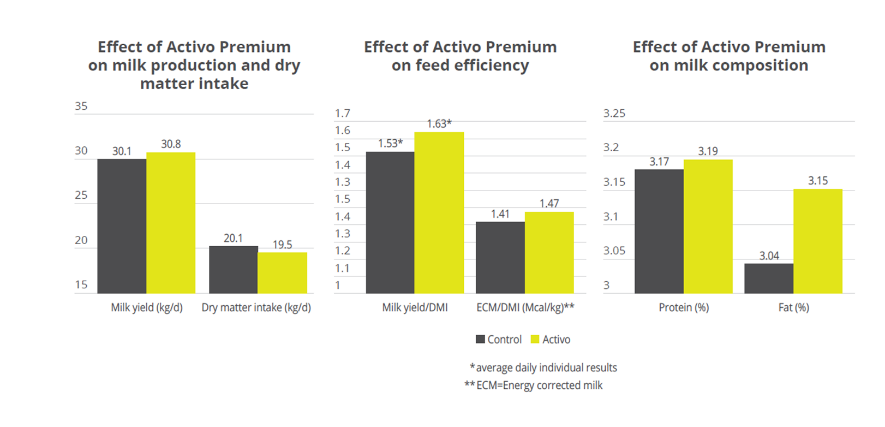
Phytogenic product Activo Premium contains a targeted phytomolecules mix capable of influencing the rumen microbiome in this manner:
Activo Premium is a blend of phytomolecules that maximizes production results for both high- and low-energy diets. Studies show that Activo Premium’s effects on the on the rumen microbiome reduce the ratio of acetic to propionic and butyric acid and decrease the energy losses due to methane production.
Field trial: Activo Premium improves rumen fermentation processes
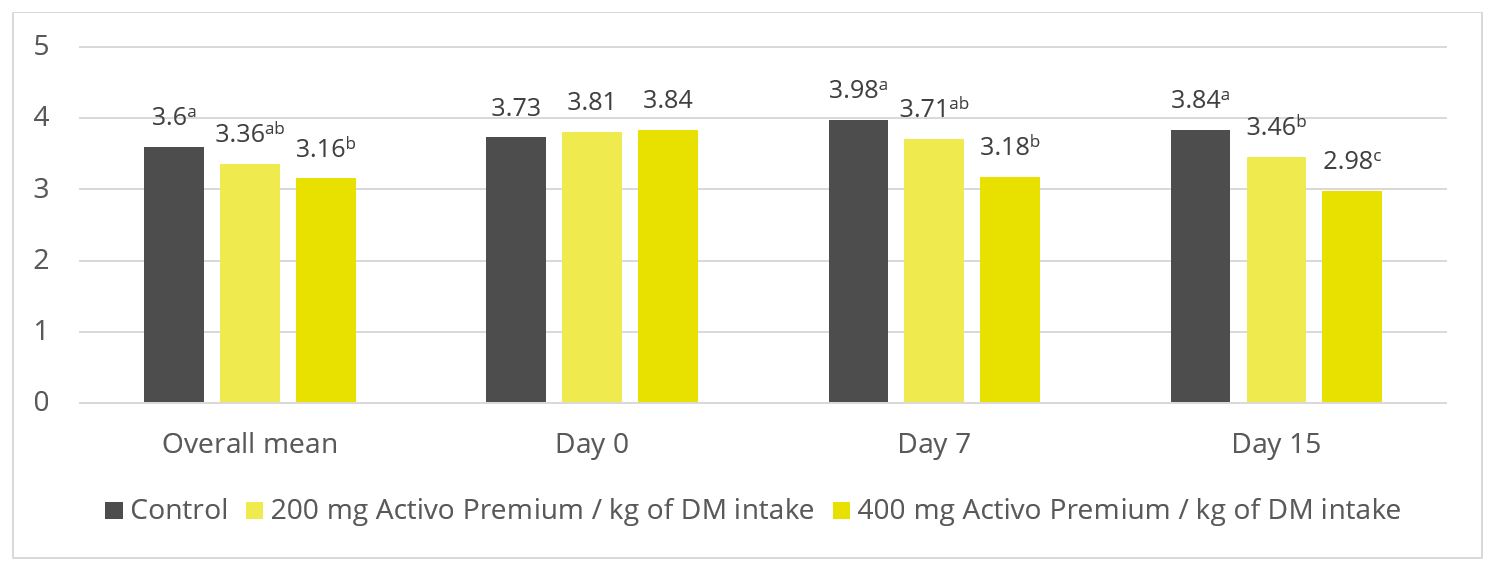
A trial at the University of São Paul, Brazil, sought to evaluate the impact of Activo Premium on rumen fermentation and methane emissions. Nine rumen-cannulated sheep (55 ± 3.7 kg of body weight) were divided into 3 groups, and randomly distributed in a triple 3×3 Latin square design. The animals were fed their experimental diets for 22 days (the sampling period) in the following 3 set-ups: one control group (basal diet without additives); one group receiving a basal diet with 200 mg of Activo Premium per kg of dry matter intake; and one group receiving a basal diet with 400 mg of Activo Premium per kg of dry matter intake.
Figure 2: Ratio of acetate to propionate (p = 0.03)
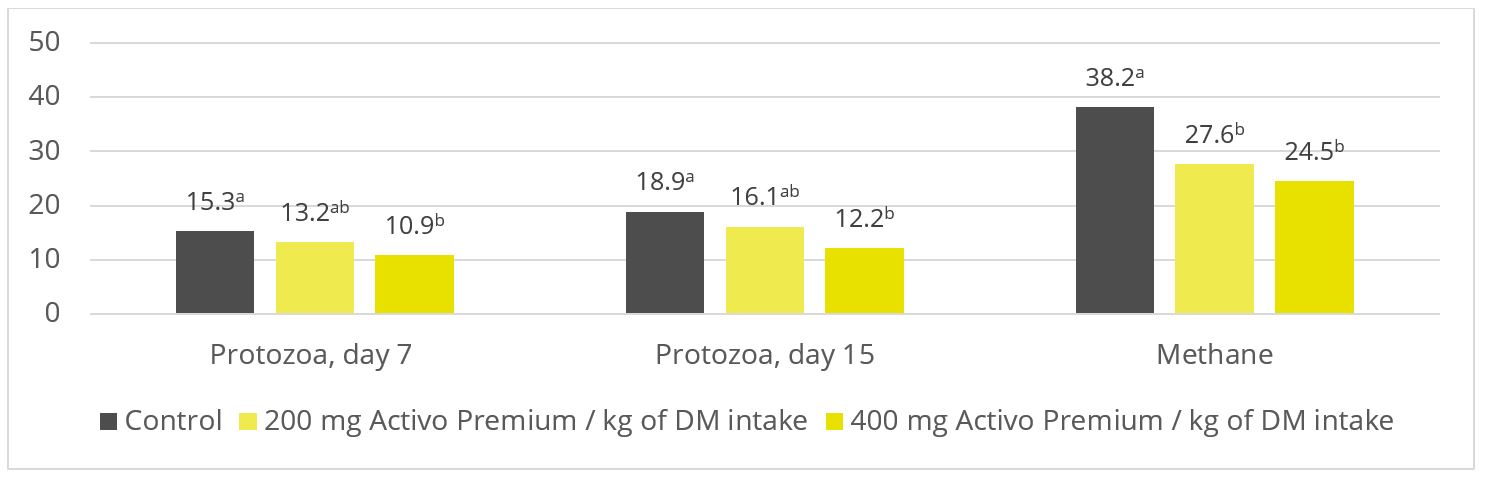
Figure 3: Protozoa count (p = 0.06; x 105 / ml) and methane production (p < 0.01; l per kg of dry matter). Based on Soltan et al. (2018)
As shown in figures 2 and 3, Activo Premium favourably modifies the ratio of volatile fatty acids and reduces the protozoa count, which, as to be expected, results in reduced methane emissions.
Rumen simulation trial: the more Activo Premium added, the less methane produced
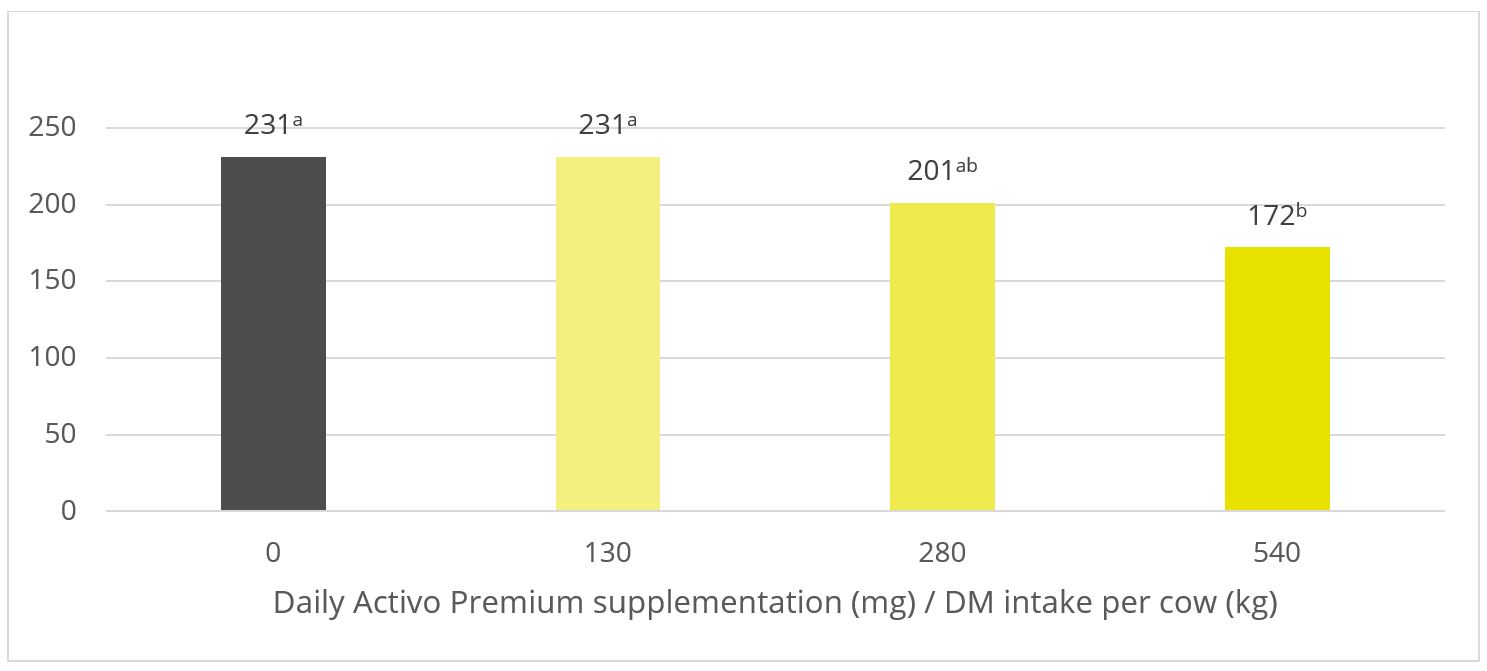
A trial was conducted at the University of Hohenheim (Germany) sought to evaluate the methane-reducing effects of different inclusion rates of Activo Premium, using a continuous long-term rumen simulation technique (Rusitec). Four different inclusion levels of Activo Premium (0, 2.1, 4.2, and 8.4 mg/d) were added to a diet with a ratio of concentrates to roughages of 80% to 20%, respectively.
Five consecutive Rusitec runs with one replication of each of the four inclusion schedules were performed. The run lasted for 14 days; 7 days were used for adaptation and the later 7 days for sampling. The fermenters were heated to 39°C. During the sampling period, total gas production and methane concentration of the total gas produced were measured every 24 h.
Figure 4: Methane emission (ml / day) for increasing inclusion rates of Activo Premium
In this trial with a rumen simulation system, Activo Premium significantly reduced methane volume (Figure 4): from 231 ml/d for the diet without any Activo Premium to 172 ml/d for the highest inclusion rate of Activo Premium.
Activo Premium: reduce methane emissions, support your profits and our planet
Both in vivo and in vitro trials have shown with high statistical reliability that Activo Premium can positively modulate rumen fermentations. The strategic combination of phytomolecules appears highly effective as a natural dietary supplementation option to modulate ruminal fermentation and decrease methane emissions. Adding Activo Premium to dairy cows’ diet will likely contribute significantly to reducing their methane emissions and optimizing their energy balance – improving animal performance while curbing the climate change impact, a win-win for everyone.
References
Czerkawski, J. W. “Effect of Linseed Oil Fatty Acids and Linseed Oil on Rumen Fermentation in Sheep.” The Journal of Agricultural Science 81, no. 3 (1973): 517–31. https://doi.org/10.1017/s0021859600086573
Guglielmelli, Antonietta (2009) Studio sulla produzione di metano nei ruminanti: valutazione in vitro di alimenti e diete. [Tesi di dottorato] (Unpublished) http://www.fedoa.unina.it/3960/
Johnson, D.E., and K.A. Johnson. “Methane Emissions from Cattle.” Journal of Animal Science 73, no. 8 (August 1995): 2483–92. https://doi.org/10.2527/1995.7382483x
Knapp, J.R., G.L. Laur, P.A. Vadas, W.P. Weiss, and J.M. Tricarico. “Invited Review: Enteric Methane in Dairy Cattle Production: Quantifying the Opportunities and Impact of Reducing Emissions.” Journal of Dairy Science 97, no. 6 (2014): 3231–61. https://doi.org/10.3168/jds.2013-7234
Lourenço M., P. W. Cardozo, S. Calsamiglia, and V. Fievez. “Effects of Saponins, Quercetin, Eugenol, and Cinnamaldehyde on Fatty Acid Biohydrogenation of Forage Polyunsaturated Fatty Acids in Dual-Flow Continuous Culture fermenters1.” Journal of Animal Science 86, no. 11 (November 1, 2008): 3045–53. https://doi.org/10.2527/jas.2007-0708.
Patra, Amlan K., and Jyotisna Saxena. “A New Perspective on the Use of Plant Secondary Metabolites to Inhibit Methanogenesis in the Rumen.” Phytochemistry 71, no. 11-12 (August 2010): 1198–1222. https://doi.org/10.1016/j.phytochem.2010.05.010.
Piva, Jonatas Thiago, Jeferson Dieckow, Cimélio Bayer, Josiléia Acordi Zanatta, Anibal de Moraes, Michely Tomazi, Volnei Pauletti, Gabriel Barth, and Marisa de Piccolo. “Soil Gaseous N2O and CH4 Emissions and Carbon Pool Due to Integrated Crop-Livestock in a Subtropical Ferralsol.” Agriculture, Ecosystems & Environment 190 (2014): 87–93. https://doi.org/10.1016/j.agee.2013.09.008
Soltan, Y.A., A.S. Natel, R.C. Araujo, A.S. Morsy, and A.L. Abdalla. “Progressive Adaptation of Sheep to a Microencapsulated Blend of Essential Oils: Ruminal Fermentation, Methane Emission, Nutrient Digestibility, and Microbial Protein Synthesis.” Animal Feed Science and Technology 237 (March 2018): 8–18. https://doi.org/10.1016/j.anifeedsci.2018.01.004.
Supapong, C., A. Cherdthong, A. Seankamsorn, B. Khonkhaeng, M. Wanapat, S. Uriyapongson, N. Gunun, P. Gunun, P. Chanjula, and S. Polyorach. “In Vitro Fermentation, Digestibility and Methane Production as Influenced by Delonix Regia Seed Meal Containing Tannins and Saponins.” Journal of Animal and Feed Sciences 26, no. 2 (2017): 123–30. https://doi.org/10.22358/jafs/73890/2017
Succi, Giuseppe, and Inge Hoffmann. La Vacca Da Latte. Milano: Cittá Studi, 1993.
From sub-acute ruminal acidosis to endotoxins: Prevention for lactating cows
by Technical Team, EW Nutrition
Sub-acute acidosis (SARA) is linked to high levels of ruminal LPS. The LPS cause inflammation and contribute to different metabolic conditions and diseases. Various strategies and solutions can be applied to modulate the rumen microbiota and prevent this risk.
In sub-acute rumen acidosis (SARA), the quantity of free lipopolysaccharides (LPS) coming from Gram- bacteria increases considerably. These LPS cross the ruminal wall and intestine, passing into the bloodstream. The negative consequences on the health of the animal are then reflected in decreased productive and reproductive performance.
The LPS are released during the lysis of GRAM- bacteria which die due to the low pH, and these bacteria are mainly responsible for the production of propionic acid for the energy yield that is obtained. It is essential to preserve ruminal balance between Gram+ and Gram- such that there is no excess of LPS.
Nutritional needs of lactating cows with SARA
In the first phase of lactation (from 1 week after calving to 80 – 100 days of lactation), the cow needs a high energy level to meet the large demand for milk production. This energy demand is often not fully satisfied and feed intake falls short. This deficit leads to the need to provide as much energy as possible per feed ration.
Imagine a 650 kg live weight cow, producing about 35 kg of milk per day with a fat percentage of 3.7 and a protein percentage of 3.2. To achieve this production level and fulfill its maintenance requirements, this animal needs a feed intake of 22 kg of dry matter (DM) per day, with an energy level of 21 UFL equal to 36,000 Kcal/day of NE l (Net Energy Lactation)).
To obtain an energy supply of this type, it is necessary to provide rations with a high content of cereals rich in nonstructured carbohydrates (NSC). This will allow the animals to obtain the maximum efficacy in getting the NE I from the metabolizable energy (ME) expressed as kl*.
*kl expresses the effectiveness in passing from EM to EN l net of the heat dissipated by the animal, therefore kl = ENl/EM (Van Es 1978).
Compared to a diet rich in NDF (Neutral Detergent Fiber), this type of diet promotes and stimulates certain strains of bacteria to the detriment of others, shifting the balance towards a greater population of bacteria that produce propionic acid instead those which produce acetic acid. This change also determines a greater share of Gram- compared to Gram+.
What is rumen acidosis?
Rumen acidosis is that “pathology” whereby the volume of SCFA (Short Chain Fatty Acids) produced by the rumen bacteria is greater than the ability of the rumen itself to absorb and neutralize them. Rumen acidosis is mainly caused by the amylolytic and saccharolytic bacteria (Streptococcus bovis; Selenomonas ruminantium, Bacteroides amylophilus, Bacteroides ruminicola and others) responsible for the production of lactic acid. Unlike the other most representative volatile fatty acids (acetic, butyric and propionic), lactic acid has a lower pKa: 7 (3.9 versus 4.7). This means that for the same amount of molecules produced, lactic acid releases a number of ions H+ in the fluid ten times greater than other VFAs, with evident effects on the pH.
Ruminal acidosis can be characterized as acute or subacute. During acute ruminal acidosis, the pH in the rumen drops below 4.8 and remains low for an extended period of time. Acute acidosis leads to complete anorexia, abdominal pain, diarrhea, lethargy, and eventually death. However, the prevalence of acute acidosis in dairy is very low.
Consequences of rumen acidosis
In such situations, a series of negative consequences can be triggered in the lactating cow. Investigations (for instance, using fistulated cows) can reveal, among others, the following alteration in the rumen:
Shift in total microbiome rumen profile (density; diversity; community structure)
Shift in protozoa population (increase in ciliates protozoa after 3 weeks of SARA; increase in the GNB population)
Shift in fungi population (decreasing the fungi population with high fibrolytic enzymes, which are sensitive to low pH)
Rise in LPS rumen concentration (increasing the GNB strain and their lysis)
Influence on the third layer of Stratified Squamous Epithelium (SSE) (desmosomes and tight junctions)
Lower ruminal fiber degradation (reduction in the number of cellulolytic bacteria which are less resistant to acid pH)
Reduction of the total production of fatty acids (propionic, acetic, butyric), therefore less available energy
Lower rumen motility (also as a consequence of the smaller number of protozoa)
The increased acid load damages the ruminal epithelium
Acid accumulation increases the osmotic pressure of the rumen inducing an higher flux of water from the blood circulation into the rumen, causing swelling and rupture of rumen papilla as well as a greater hemoconcentration
The last points are extremely important, as it enables an easier passage of fluids from the blood to the pre-stomachs, greatly influencing the fermentation processes.
Furthermore, with diets low in NDF, the level of chewing and salivation is certainly lower, with a consequent lower level of salivary buffers that enter the rumen and which would maintain an appropriate pH under normal conditions.
Rumen sub-acute and acute acidosis: a fertile ground for LPS
Studies inducing SARA in dairy cows have shown that feeding high levels of grain causes the death and cell lysis of Gram- bacteria, resulting in higher concentration of free LPS in the rumen. In a trial conducted by Ametaj et al., in 2010 (Figure 1), a lower ruminal pH and an increase in the concentration of LPS in the rumen fluid -measured as ng / ml (nanograms / milliliter)-, was the result of increasing of NSC present in the diet (% of grains).
Figure 1. The increase in the level of endotoxins in the rumen is directly correlated with an increase in ration concentrates
In the rumen, the presence of Gram- is very significant, however the dietary changes towards high energy concentrates, reduce the substates necessary for them to thrive, leading to their lysis and favoring gram-positive bacteria (Gram+). Gram+ also produce bacteriocins against a wide variety of bacteria, including many Gram-. Figure 2 shows the influence of ruminal pH in the population of different bacteria, many of which are are crucial for the production of SCFA and therefore of energy.
Figure 2. Activity of main bacteria in the rumen in function of pH (Daniele Cevolani Edizioni Agricole di New Business Media srl 2020)
It is therefore necessary to pay close attention to the energy level of the ration as an energy input (generally around 1500 – 1700 Kcal/kg of DM intake). At the same time, we need to ensure that the animal does receive and ingest that daily amount of DM. If ingestion is negatively influenced by acidosis (clinical or sub-clinical), this can lead to endotoxemia, with harmful consequences for the animal’s health and production performance.
We can therefore note that the level of LPS (endotoxins) present in the rumen is directly correlated with the pH of the rumen itself and with a symptomatologic picture dating back to SARA. This occurs when the mortality and lysis of Gram- bacteria (GNB) is high and through the consequent imbalance created with diets containing excess fermentable starches, compared to diets with higher fiber content.
In fact, it was shown that the transition from a concentrated fodder ratio of 60:40 to a more stringent ratio of 40:60 caused the level of free LPS in the rumen to go from 410 to 4.310 EU / ml.
Endotoxemia: Pathological consequences in dairy cows
Once the LPS enter the bloodstream, they are transported to the liver (or other organs) for the detoxification. However, sometimes this is not enough to neutralize all the endotoxins present in blood. The remaining excess can cause issues such as the modification of the body’s homeostasis or cause that cascade of inflammatory cytokines responsible for the most common pathologies typical in cows in the first phase of lactation. The most common symptoms are the increase of somatic cells in milk or claws inflammation.
Pro-inflammatory cytokines as TNF, IL6 and IL8 induced by LPS-related inflammation are able to stimulate the production of ACTH (adrenocorticotropic hormone).
ACTH, together with cortisol and the interleukins, inhibit the production of GnRH and LH, with serious effects on milk production. The productivity and the fertility of the animal are thus compromised.
Moreover, prostaglandins are as well stimulated by LPS, and are linked with fever, anorexia and ruminal stasis. This not only limits the amount of energy available for production and maintenance functions, but also induces a higher susceptibility to disease and adds-up to the emergence of other metabolic conditions, such as laminitis and mastitis.
Preventing rumen acidosis
The solution to these massive risks is a prudent and proactive approach by the nutritionist towards all situations that can cause a rapid increase of Gram- in the rumen.It is therefore necessary to avoid cases of clinical and sub-clinical acidosis (SARA) in order to avoid the issues listed above. This would also help avoid stressful conditions for the animal that would lead to decreased performance and health.
To maintain balance and a healthy status of the animal, the use of additives such as phytomolecules and binders is suggested in the first phase of lactation, starting from 15 days before giving birth.
Activo Premium (a mix of phytogenic substances) has given excellent results in decreasing the acetic/propionic acid ratio, while safeguarding the population of Gram+ bacteria. This is in contrast to treatments with ionophores, which, as is well known, interfere with the Gram+ population.
Case study. Acetic acid:propionic acid ratio with Activo Premium
In a study conducted at the the University of Lavras and the Agr. Res. Comp. of Minas Gerais (both Brazil), 30 Holstein cows were allocated to two groups considering parity and milk production. One group was fed the standard feed (control), the other group received standard feed containing 150mg of Activo Premium/kg of dietary dry mass (DM). The following parameters were measured or calculated: intake of DM and milk production, milk ingredients such as fat, protein, lactose every week, body weight and body condition score every two weeks, and ruminal constituents (ph and SCFAs) through oesophaeal samples at day 56.
Activo Premium was able to decrease the ratio between acetic acid and propionic acid, and at the same time maintain the level of Gram+ bacteria in the rumen, thus reducing the risk of endotoxins.The same trial carried out at the University of Lavras demonstrated how the performance of the animals was superior in the group fed with Activo Premium compared to the control group (see below).
Figure 3. Effect of Activo Premium on ruminal constituents
Figure 4. Effect of Activo Premium on animal performance
Solution: Preserve Gram+ bacteria levels while decreasing free LPS
We have therefore seen how important it is to decrease the acetic:propionic ratio in the rumen to obtain a greater share of available energy. However, the level of endotoxins in the rumen must remain low in order to avoid those problems of endotoxemia linked to very specific pathologies typical of “super productive cows”. These pathologies (always linked to inflammatory manifestations) can be prevented by decreasing the level of free LPS in the rumen with a product that can irreversibly bind the LPS and thus make them inactive.
In a trial with porcine intestinal cells (IPEC-J2) challenged by E. coli LPS, a decrease in the intensity of inflammation was observed when Mastersorb Gold was added. This decrease could be shown through a lower amount of phosphorylated NF-kB in an immunofluorescence trial, as well as through the reduced production of Interleukin (IL)-8 in the cells measured by ELISA.
The fact that pig intestine tissue was used does not affect the adsorption concept. In this case, these intestinal cells are only a vehicle to demonstrate that in an aqueous solution containing 50 ŋg of LPS / ml and in the same solution with the addition of Mastersorb Gold, the level of LPS actually active is decreased, as a part of the LPS was tied up by Mastersorb. The solution with a lower level of LPS gave minor “inflammatory” reactions to intestinal cells, and this can be statistically reported in dairy cows.
Figure 5. Immunofluorescence in PEG-J2: Challenge with LPS without (in the middle) and with Mastersorb Gold (right)
Figure 6. IL-8 AP secretion after incubation with LPS 0111:B4 for 24h without and with Mastersorb Gold
Conclusions
To demonstrate how the decrease in the level of LPS in the rumen is directly correlated with inflammatory states in general, a trial with a total of 60 dairy cows shows that the inclusion of 25g of Mastersorb Premium/animal/day increases milk yield and improves milk quality by decreasing somatic cell count. Adsorbing substances contained in Mastersorb Premium tie up the LPS produced in the rumen in different cow lactation phases.
Normally, the rise in the level of somatic cells in milk depends on etiological agents such as Streptococcus spp, Staphylococcus spp, mycoplasma and more. LPS stress is not the sole agent responsible for raising somatic cell counts, but also other factors among which:
Lactation stage and age of the animal
Season of the year (in summer the problem is increased)
Milking plant (proper maintenance)
General management and nutrition
However, by reducing the level of LPS, Mastersorb provides an important aid to decrease somatic cell count.
Figure 7. Effect of Mastersorb Premium on somatic cell count
Prevent escalation with rumen balance
In the end, ruminant producers are, like all livestock operations, interested in producing healthy animals that can easily cope with various stressors. Ensuring a proper diet, adjusted to the energy requirements of various production stages, is a first step. Providing the animal with the ingredients that modulate the microbiota and reduce the negative impact of stress in the rumen is the next essential step in efficient production.
Nowadays, dairy cows are real top athletes. This comes with additional challenges for their health and for on-farm management. Many of these problems can be traced back to supply deficits and can be easily managed with appropriate feed supplements.
Milk fever is a disease that occurs mainly in cows around calving. It is caused by an insufficient amount of calcium in the blood and particularly affects cows with a very high milk yield.
The link between calcium and milk fever
Calcium performs essential functions in the body. It is particularly important for the nervous system and muscle cells, and plays a central role in muscle contraction. If the calcium content in the blood is too low, the muscles can no longer contract. When this happens, the cows cannot move or stand up.
While mild cases may not be easily detectable, they still trigger productivity loss. If undetected, long-term calcium deficiency can even lead to cardiac arrest and thus to the death of the animal.
The development of milk fever
The cause of milk fever is a lack of sufficient calcium in the blood serum (hypocalcemia). The dairy cow has to abruptly change its metabolism at the end of the dry period, going from the resting phase to a high performance phase. During the dry period, cows have a relatively low need for calcium.
When lactation starts, the need for calcium suddenly almost doubles, as large amounts of calcium are required for the production of colostrum (2.3 g/l). The calcium is generally drawn from feed or from the bones. In older cows, the mobilization mechanism often does not start quickly enough. The supply from the bones and feed is insufficient and the body draws the missing calcium from the muscles. This ultimately leads to symptoms of paralysis and overstimulation of the nervous system.
Phases of milk fever
Stage One
In the initial phase of milk fever, the initial signs are
muscle tremors
restlessness
stiff gait
slightly elevated temperature
Stage Two
At this point, the cows lie on the stomach with an extended neck or the head is lying on the flank. Early symptoms of paralysis appear:
fast, flat pulse
cold body surface
dilated pupils
flatulence
Stage Three
In the last phase of milk fever, the cow lies on its side, loses consciousness and falls into a coma. The third phase often leads to death (the mortality rate averages 2 – 5%).
While the second phase of milk fever is easy to recognize due to the clear symptoms, the consequences of a “slight” calcium deficiency (Stage One) are often underestimated. Feed intake diminishes, the negative energy and protein balance is increased, and the cows barely move. The impairment of the muscles can cause problems in the udder (mastitis) or in the gastrointestinal tract.
Prevention and solutions
As cases of hypocalcemia immediately after calving may be as high as 50% among second- or third-lactation cows, it is important to act preventively to keep potential milk fever from developing. The dairy farmer´s aim is to support the dairy cows that are at higher risk of milk fever, especially around the critical time of calving. The cows must be enabled to quickly release calcium from the bones after calving, or they must be supplied with calcium that can be easily metabolized.
Upfront prophylaxis
An energy and protein oversupply during the dry period should be avoided. In addition, an application of Vitamin D3 at the end of the pregnancy makes sense.
To stimulate the active regulatory mechanisms of calcium metabolism, the calcium content in the feed should be reduced three to four weeks before calving. In practice, however, this often is not properly observed and feed with a relatively high calcium content is still given out during this period.
There are, no doubt, farms where these above-mentioned preventive measures cannot be carried out due to operational reasons, just as there are animals that are particularly susceptible due to factors such as age, breed or healthy history.
To protect the cow from milk fever around calving, oral administration of calcium salts is widespread in practice. Vitamin D also plays a central role in calcium metabolism. It ensures that the absorption of calcium from the intestines and bones is increased.
When administering oral calcium supplements, there are three important points:
– The cow must have sufficient calcium available per dosage
– The calcium must be available immediately
– Administration must be appropriate for the animals and farmers
Methods of calcium supplementation
To support the cow, oral supplements such as pastes and gels are widely used. They are useful, however they are also relatively difficult to administer, as they require handling the animal in relatively difficult ways.
Liquids are another way of administering calcium supplements. When administering liquids, it is important to make sure the animal does not choke so that the liquids do not get into the lungs.
Boluses are probably the easiest and safest method of supplementation to prevent milk fever. The bolus must naturally be carefully inserted, however the process is easy and requires minimal handling of the animal.
EW Nutrition´s Calzogol Bolus is a dietetic mineral feed with a high level of calcium from of highly available calcium salts and vitamin D3. The Calzogol Bolus contains several calcium sources with different release rates. One major advantage is the very high mucous membrane compatibility, which helps avoid irritation of the mouth, esophagus and rumen. Furthermore, the Calzogol Bolus does not contain caustic calcium chloride. The application is simple and economical, as only one bolus per dose must be administered at the time of calving.
Conclusion
Milk fever is very common in dairy herds. When a cow has milk fever, the farm can incur costs of approx. €350. This is reflected in the loss of milk yield up to 600 kg, losses due to unusable milk, and veterinary and medication costs.
Time resources are also to be taken into account: The economic repercussions represent a significant factor, however they come on top of the extra workload due to the increased need for care of animals.
Cows that suffer from calcium deficiency are also much more susceptible to other diseases. For the farmer, the best strategy is to avoid losses through prophylaxis. Feeding plays a central role; to ensure the best possible production conditions, oral calcium administrations, such as Calzogol Bolus, have proven themselves in practice.
by Judith Schmidt, Product Manager, On Farm Solutions
References:
Rérat, M. (2005): Milchfieber bei der Milchkuh. ALP aktuell. Nr. 20.
Spiekers, H., Potthast, V. (2004): Erfolgreiche Milchviehfütterung. DLG-Verlag, Frankfurt a. M.
Kirchgeßner, M., Roth, F. X., Schwarz, F. J., Stangl, G. I. (2008): Tierernährung. 12. Auflage. DLG-Verlag, Frankfurt a. M.