Beyond the classic seven: New Eimeria species in poultry – and the phytogenic solution
by Madalina Diaconu, Business Development Manager, EW Nutrition GmbH, and Maria Angeles Rodriguez, Gut Health Platform Manager, EW Nutrition GmbHABSTRACT
Avian coccidiosis, caused by intracellular protozoan parasites of the genus Eimeria, remains one of the most economically damaging diseases in commercial poultry production, costing the global industry an estimated USD 10–14 billion annually. For decades, disease management relied on seven recognized Eimeria species infecting chickens. However, the formal characterization in 2021 of three previously cryptic species – Eimeria lata, Eimeria nagambie, and Eimeria zaria – has fundamentally altered this landscape. These newly described parasites are pathogenic, capable of compromising bodyweight gain, and critically, they evade immunity induced by all currently available commercial anticoccidial vaccines. This white paper reviews the biology and epidemiology of these emerging species, examines the limitations of conventional control strategies, and presents the scientific rationale for phytogenic compounds as a complementary, resistance-resilient solution. Specific attention is given to the mechanisms of action of saponins, tannins, thymol, cinnamaldehyde, cumin, licorice, and others against Eimeria infection, intestinal inflammation, and secondary pathogen susceptibility.
1. Introduction: A shifting coccidiosis landscape
Coccidiosis, driven by Eimeria spp. infection of the intestinal epithelium, causes morbidity through hemorrhagic or malabsorptive diarrhea, disrupted gut microbiota, and impaired immune responses. Even subclinical infections exert measurable production costs through reduced bodyweight gain, deteriorated feed conversion ratios (FCR), and heightened susceptibility to secondary pathogens – most notably Clostridium perfringens (necrotic enteritis). The disease is ubiquitous: Eimeria oocysts are environmentally resilient, highly reproductive, and transmitted via fecal-oral routes in all commercial production systems.
For more than seven decades, the field recognized seven Eimeria species as the causative agents of avian coccidiosis in chickens: E. acervulina, E. brunetti, E. maxima, E. mitis, E. necatrix, E. praecox, and E. tenella. Each species infects a distinct region of the intestinal tract and produces characteristic pathological signatures. This taxonomy formed the basis for all commercial coccidiosis vaccines and the design of anticoccidial rotation programs.
In 2021, this foundational assumption was overturned. A landmark study by Blake et al. formally named three cryptic species – previously described only as operational taxonomic units (OTUs) x, y, and z – as Eimeria lata, Eimeria nagambie, and Eimeria zaria. This discovery, enabled by next-generation genomic sequencing, has critical implications for every layer of coccidiosis control: diagnostics, vaccination, and pharmacological management.Economic context
Avian coccidiosis costs the global poultry industry approximately £10.4 billion annually at 2016 prices (Blake et al., 2020). These losses include poor growth performance, treatment costs, increased feed consumption, increased replacement of chicks, and enhanced susceptibility to concurrent infections such as necrotic enteritis.
2. The three new Eimeria species: Biology, pathogenicity, and global spread
2.1 Discovery and formal classification
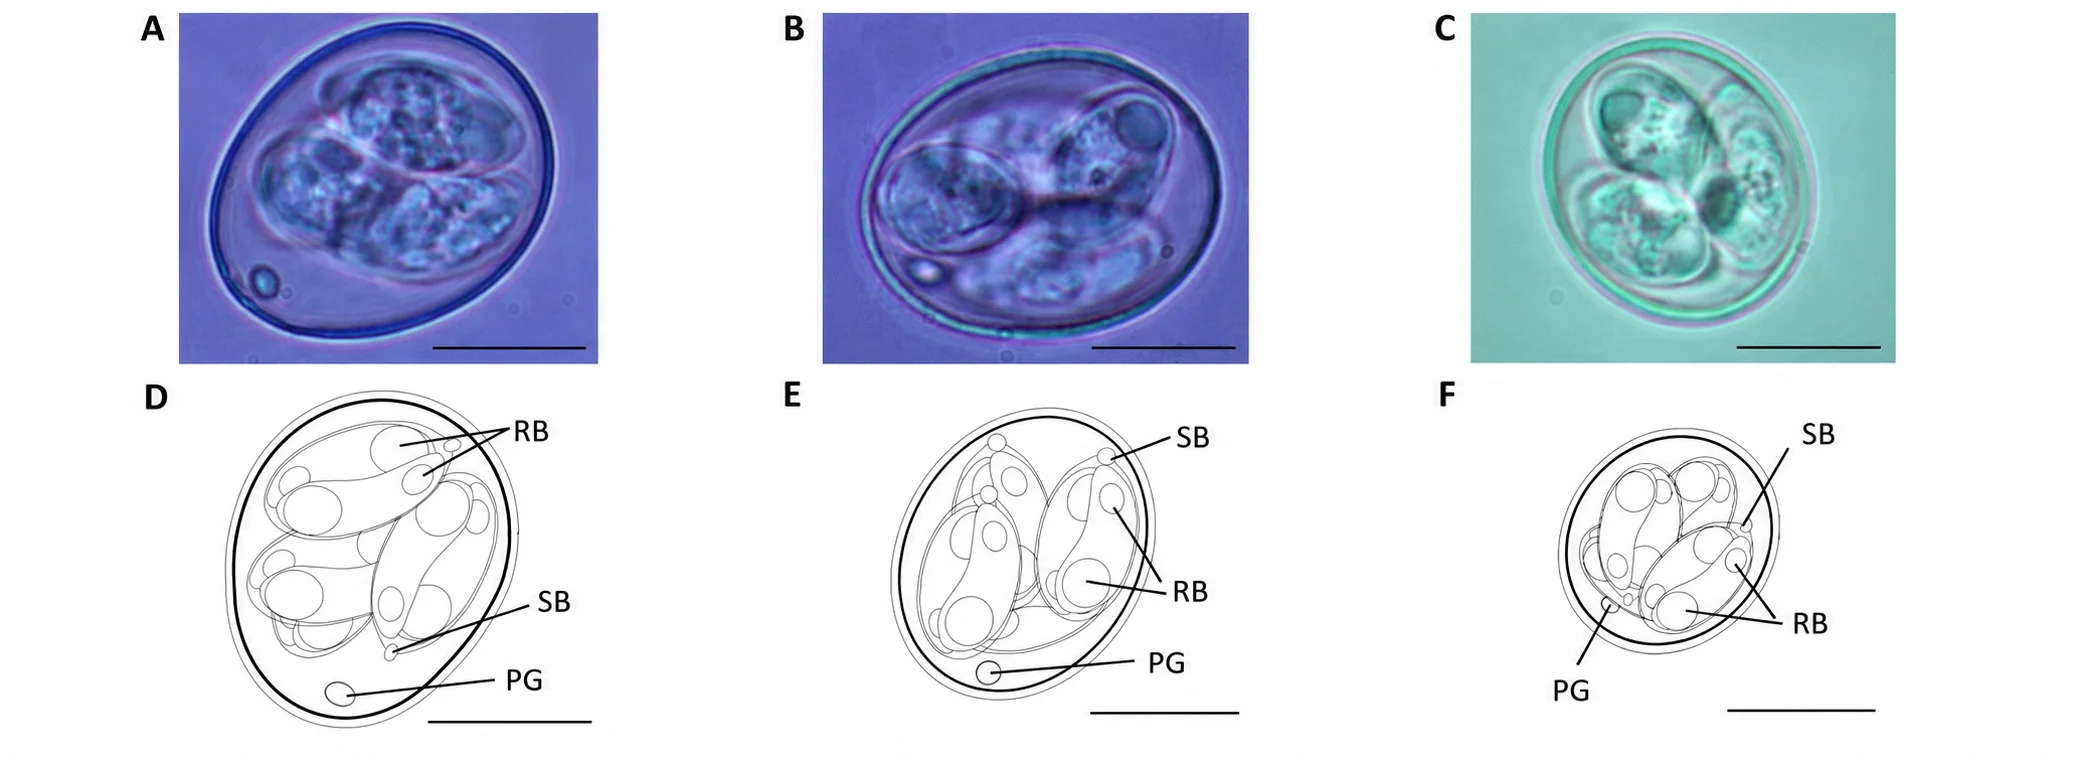
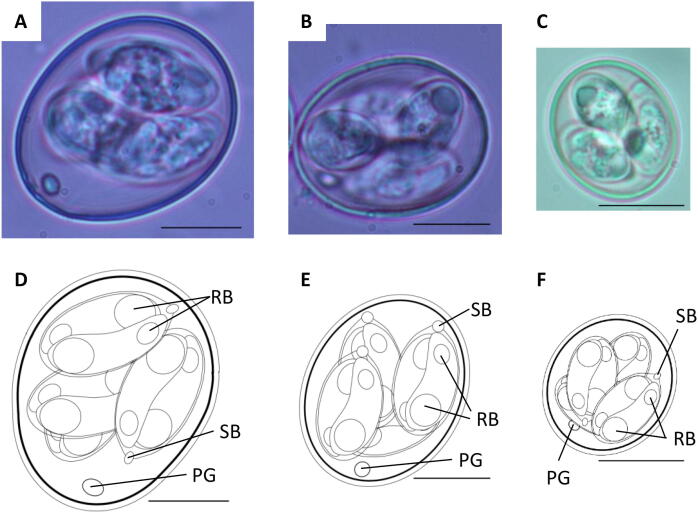
The three cryptic Eimeria OTUs were first identified through molecular epidemiological surveys in Australia in 2007–2008 (Cantacessi et al., 2008). Initially named OTU-X, OTU-Y, and OTU-Z, these genotypes showed consistent genetic divergence from the seven recognized species but lacked formal biological characterization. Blake et al. (2021), working at the Royal Veterinary College (UK), conducted an exhaustive characterization combining oocyst morphology, pre-patent periods, pathology, and draft genome sequence assemblies. The conclusion was unambiguous: all three OTUs possess sufficient genetic and biological diversity to constitute new species.
The three new species were named:
Eimeria lata n. sp. (formerly OTU-X): Named for its unusually wide oocyst morphology – the broadest average oocyst width of any Eimeria species infecting chickens.
Eimeria nagambie n. sp. (formerly OTU-Y): Named after Nagambie, Victoria, Australia, the location of the first isolate.
Eimeria zaria n. sp. (formerly OTU-Z): Named after Zaria, Nigeria, reflecting the geographic origin of its initial isolation.
2.2 Pathogenicity and production impact
Experimental infection trials demonstrated that all three new species are capable of compromising broiler bodyweight gain, a direct measure of economic impact. Unlike historically recognized species such as E. acervulina and E. tenella, whose pathological signatures are well-characterized, the intestinal tropism and precise pathological mechanisms of E. lata, E. nagambie, and E. zaria remain under active investigation. Their clinical presentation may overlap with existing species, complicating field diagnosis through standard lesion scoring alone.
The Eimeria-gut microbiota interaction is particularly relevant here. Research has demonstrated that Eimeria infection disrupts intestinal bacterial communities, reducing beneficial taxa and creating dysbiosis conditions that facilitate opportunistic bacterial overgrowth – most critically by C. perfringens. The bidirectional interaction between coccidiosis and necrotic enteritis leads to cumulative economic burdens. However, it remains to be determined whether the newly identified species possess distinct microbiota-modulating profiles.
2.3 Geographic distribution and diagnostic blind spots
Initially considered geographically restricted to the Southern Hemisphere, detection has since expanded significantly. One or more of the three new species have now been confirmed in Australia, multiple sub-Saharan African countries, India, Venezuela, the United States, and – as of 2023 – Europe, with the first reported detection of E. zaria in European broiler flocks (Jaramillo-Ortiz et al., 2023). The heavy reliance of existing diagnostic protocols on oocyst morphology and PCR panels developed for the original seven Eimeria species raises concerns that newly identified species are routinely underdetected in field surveillance.Critical diagnostic gap
Standard coccidiosis diagnostics – including lesion scoring, oocyst morphology, and many commercial PCR kits – were designed around the seven classical Eimeria species. E. lata, E. nagambie, and E. zaria may circulate undetected in flocks, contributing to unexplained performance losses and vaccine failures. Next-generation sequencing (NGS) targeting 18S rRNA is currently the most reliable identification tool (Blake et al., 2021).
2.4 Vaccine evasion: The central challenge
The most commercially disruptive characteristic of the three new species is their demonstrated ability to evade immunity induced by all currently available commercial anticoccidial vaccines. Live attenuated coccidiosis vaccines, the cornerstone of antibiotic-free coccidiosis control programs, are designed against the original seven species. Experimental challenge studies confirmed that prior vaccination provides no protective immunity against E. lata, E. nagambie, or E. zaria (Blake et al., 2021). This creates a significant vulnerability in integrated coccidiosis control programs, particularly in broiler production systems where vaccination programs are used as the primary long-term resistance management strategy.
The inability of current vaccines to address these new species underscores a critical need for broad-spectrum, mechanism-resilient complementary tools. Phytogenic compounds, acting through multiple simultaneous mechanisms, represent an ideal candidate for this role.
3. Current control strategies and their limitations
3.1 Chemical anticoccidials and ionophores
Chemical anticoccidials (e.g., diclazuril, toltrazuril, amprolium) and ionophore antibiotics (e.g., monensin, salinomycin) remain the primary pharmaceutical tools for coccidiosis control globally. These compounds target specific metabolic or ion transport mechanisms in Eimeria and have historically been highly effective when deployed in rotational shuttle programs. However, decades of continuous use have driven the emergence of resistance across multiple drug classes. Field resistance to monensin, robenidine, salinomycin, maduramicin, and diclazuril has been extensively documented across multiple geographic regions (Ferdji et al., 2022; Flores et al., 2022).
Resistance development occurs through multiple mechanisms: altered cell membrane permeability reducing drug uptake, use of alternative biochemical pathways, mutations at drug target sites, and genetic recombination within Eimeria populations. Crucially, resistance to one drug class does not necessarily confer resistance to compounds with different mechanisms – providing the theoretical basis for rotation programs. However, field conditions, partial compliance, and concurrent use often undermine the protective effects of rotation strategies.
3.2 Vaccines: Effective but incomplete
Live attenuated and live non-attenuated coccidiosis vaccines have represented a major advance in resistance management, offering cycle-by-cycle immunity development without driving pharmacological resistance. In broiler production, their use has grown significantly in recent years, particularly in no-anticoccidial or antibiotic-free production systems. However, as established in Section 2.4, no current commercial vaccine confers immunity against E. lata, E. nagambie, or E. zaria. This gap is not a minor caveat – it means that a vaccinated flock may be fully protected against classical species while remaining completely susceptible to the three newly described ones.
3.3 The regulatory and consumer pressure context
Across the European Union and in growing markets globally, regulatory restrictions on preventive antibiotic use, ionophore limitations in organic systems, and consumer demand for residue-free products have created strong incentives to explore alternatives. The combination of resistance pressure, vaccine limitations against new species, and regulatory trends makes the case for phytogenic integration both scientifically and commercially compelling.
4. Phytogenics as a multi-mechanism solution
4.1 Why phytogenics are relevant for coccidiosis control
Phytogenic compounds – plant-derived bioactive molecules including essential oil components, polyphenols, saponins, tannins, alkaloids, and bitter glycosides – have gained substantial scientific attention as a class of natural feed additives with demonstrated antimicrobial, antiparasitic, antioxidant, and immunomodulatory properties. Their relevance to coccidiosis management is grounded in three complementary properties: (1) direct antiparasitic action against Eimeria oocysts, sporozoites, and intracellular stages; (2) protection and restoration of intestinal mucosal integrity following Eimeria-induced damage; and (3) modulation of host immune responses to improve resilience against both Eimeria and secondary pathogens.
A key advantage of phytogenic compounds over conventional anticoccidials is their multi-target mode of action. Because each active molecule typically acts on multiple biological pathways simultaneously, the probability of resistance development through a single mutation is substantially lower than for single-target drugs. Furthermore, the inclusion of phytogenic blends in programs alongside vaccines or anticoccidials can provide synergistic or additive coverage – particularly relevant now that three new Eimeria species fall outside the protective scope of all available vaccines.
4.2 Compound-specific mechanisms of action
The following section reviews the scientific evidence for eight key phytogenic compounds relevant to coccidiosis control. A summary table is presented at the end of this section.
Saponins
Saponins are amphiphilic glycosides found in diverse plant species including Quillaja saponaria and Yucca schidigera. Their anticoccidial activity is primarily attributable to their capacity to interact with and disrupt lipid bilayer membranes. In the context of Eimeria, this membrane-disrupting action weakens the structural integrity of the parasite’s outer protective layers, rendering it more vulnerable to host immune effectors. Importantly, saponins also impair Eimeria attachment to intestinal epithelial cells, interrupting the invasion cascade. Bafundo et al. (2020) demonstrated that broilers receiving Quillaja/Yucca-derived saponin diets showed significantly reduced oocyst counts and improved weight gain compared to untreated controls challenged with Eimeria spp. Abbas et al. (2012), in a comprehensive botanical review, concluded that saponins significantly reduce both oocyst shedding and intestinal lesion scores, with efficacy approaching that of conventional anticoccidials.
Tannins
Tannins are polyphenolic compounds classified as condensed (proanthocyanidins) or hydrolysable (ellagitannins, gallotannins), found in chestnut, quebracho, and oak, among others. Their antiparasitic action against Eimeria involves protein precipitation at the parasite cell membrane – a non-specific mechanism that does not readily lend itself to resistance development. Tannins also exert strong antioxidant activity, directly reducing oxidative stress in intestinal tissue damaged by Eimeria – a crucial function given that lipid peroxidation is a primary driver of mucosal injury in coccidiosis. Masood et al. (2013) confirmed that tannin supplementation reduced intestinal oxidative stress and improved performance in broilers challenged with Eimeria. Abbas et al. (2012) further established their equivalence to chemical anticoccidials in reducing lesion severity and oocyst output.
Thymol (Thyme, Thymus vulgaris)
Thymol, the principal bioactive phenol of Thymus vulgaris essential oil, has been extensively studied for its anticoccidial properties. In vitro work by Remmal et al. (2013) demonstrated that thymol disrupts oocyst structural integrity and inhibits sporulation at concentrations of ≥2%, with maximal oocyst degeneration rates reaching 96% at 10%. At the level of intracellular parasite development, thyme essential oil was shown to inhibit the first round of schizogony in E. tenella with efficacy comparable to commercial anticoccidial drugs. Beyond direct antiparasitic action, thyme essential oil significantly downregulates pro-inflammatory mediators in Eimeria-challenged systems, reducing immune-mediated intestinal damage without suppressing protective immunity (Felici et al., 2024).
Cinnamaldehyde (Cinnamon, Cinnamomum verum)
Cinnamaldehyde, the principal aldehyde constituent of cinnamon bark, inhibits E. tenella sporozoite invasion of Madin-Darby bovine kidney (MDBK) epithelial cells in vitro, as part of a broader phenolic compound class with documented anti-invasion activity against Eimeria (Sidiropoulou et al., 2020). It reduces oocyst sporulation by approximately 79% in vitro (Remmal et al., 2013). Particularly notable is the synergistic effect between cinnamaldehyde and carvacrol (the active component of oregano oil): when used in combination, they achieve approximately 90% reduction in oocyst viability – substantially superior to either compound alone. This synergism supports the formulation of multi-compound blends. Cinnamaldehyde also demonstrates significant antimicrobial activity against Clostridium perfringens, providing simultaneous protection against the primary secondary pathogen associated with coccidiosis-driven necrotic enteritis.
Cumin (Cuminaldehyde, Cuminum cyminum)
Cumin seed contains cuminaldehyde as its primary bioactive compound, alongside cymene and other phenolic constituents. The anticoccidial relevance of cumin derives from multiple overlapping mechanisms: phenolic compounds interact with Eimeria oocyst membranes in a manner analogous to tannins, disrupting cytoplasmic membrane integrity and causing parasite cell death. Antioxidant properties protect intestinal epithelial cells from oxidative damage following Eimeria invasion. Broad-spectrum antimicrobial activity against common poultry pathogens, including C. perfringens, Salmonella spp., and E. coli, addresses the bacterial gateway mechanisms that amplify Eimeria-associated pathology. El-Shall et al. (2022) and the phytochemical coccidiosis control review (El-Shall et al., 2022) confirm cumin among the botanicals with documented anticoccidial and mucoprotective activity.
Licorice (Glycyrrhizin, Glycyrrhiza glabra)
Licorice root, through its primary bioactive compound glycyrrhizin and associated flavonoids (liquiritin, isoliquiritigenin), exerts potent immunomodulatory and anti-inflammatory effects particularly relevant to Eimeria-associated pathology. Glycyrrhizin stimulates T-cell mediated immune responses – the primary adaptive immune mechanism governing protective immunity against Eimeria – while modulating excessive inflammatory cascades that cause collateral intestinal damage. This dual action (immune stimulation + anti-inflammatory) is uniquely valuable in coccidiosis: it supports the development of parasite-specific immunity while limiting tissue destruction. Licorice compounds also support intestinal epithelium repair following Eimeria-induced villous atrophy, contributing to faster restoration of absorptive surface and productive performance. The immunomodulatory profile of licorice makes it particularly relevant as a complement to anticoccidial vaccination programs – supporting the immune priming process against classical species while potentially reinforcing innate defenses against the new, vaccine-evading species.
The right phytogenics can support coccidiosis control
Fig. 1 Lesion scores by intestinal segment. All treatments reduced lesion scores significantly compared to the positive control, but the Phytogenic was the clear winner overall, especially dominant in the caeca (E. tenella). Notably, the phytogenic products outperformed the coccidiostat on total lesion score, which is a strong result, particularly because the coccidiostat struggled against E. tenella in the caeca, where Phytogenic excelled.

Fig. 2 Microbiota recovery by day 18 pi. All four treatment groups performed similarly and dramatically better than the untreated positive control, reducing the dysbacteriosis score by roughly 45–49% compared to the positive control. The differences between the treated groups are minor and likely not statistically significant, meaning the phytogenic products performed on par with the coccidiostat in protecting gut health after Eimeria infection.

4.3 Summary: Phytogenic compound mechanisms at a glance
| Compound | Plant Source | Anticoccidial Mechanism | Key Evidence |
|
Saponins |
Quillaja, Yucca |
Disrupt Eimeria cell membranes; impair attachment to intestinal epithelium; reduce oocyst viability |
Allen et al., 1997; Abbas et al., 2012 |
|
Tannins |
Chestnut, Quebracho, Oak |
Protein precipitation; reduction of oocyst shedding; anti-inflammatory and antioxidant activity protecting intestinal mucosa |
Abbas et al., 2012; Masood et al., 2013 |
|
Thymol (Thyme) |
Thymus vulgaris |
Disrupts oocyst integrity and inhibits sporulation; reduces first round schizogony; downregulates pro-inflammatory cytokines (IL-6, IFN-γ) |
Remmal et al., 2013; Felici et al., 2024 |
|
Cinnamaldehyde |
Cinnamomum verum |
Inhibits Eimeria sporozoite invasion of intestinal epithelial cells; synergistic with carvacrol; reduces oocyst sporulation by ~79% |
Sidiropoulou et al., 2020; Remmal et al., 2013 |
|
Cumin (Cuminaldehyde) |
Cuminum cyminum |
Antiparasitic phenolic compounds interfere with oocyst membrane; antioxidant protection of intestinal epithelium; antimicrobial against secondary bacterial pathogens (NE gateway) |
El-Shall et al., 2022; Saeed & Alkheraije, 2023 |
|
Licorice (Glycyrrhizin) |
Glycyrrhiza glabra |
Immunomodulatory activity; stimulates T-cell mediated immunity against Eimeria; anti-inflammatory; supports gut epithelium repair post-infection |
El-Shall et al., 2022; Saeed & Alkheraije, 2023 |

5. Integration into coccidiosis control programs
5.1 Phytogenics in combination with vaccines
The ideal integration model for phytogenics in the context of the new Eimeria species is as a permanent background layer within any coccidiosis control program – regardless of whether that program is vaccine-based, chemical-based, or a shuttle combination. For vaccinated flocks, phytogenics provide complementary activity against E. lata, E. nagambie, and E. zaria – species against which vaccines offer no protection – while supporting the immune priming process for species covered by the vaccine. Their immunomodulatory effects (particularly licorice and thyme) optimize T-cell responses during the vaccination window.
5.2 Phytogenics in chemical anticoccidial programs
In flocks managed with chemical anticoccidials, phytogenics serve a dual function: reducing the parasite load and oocyst environmental contamination (through saponins, tannins, cinnamaldehyde, and anise), and protecting intestinal integrity during chemotherapy-related periods when mucosal recovery is needed. Given the documented resistance issues with current chemical classes, the multi-mechanism action of phytogenic blends provides coverage that complements rather than competes with pharmacological programs.
5.3 Resistance management and sustainability
A defining advantage of multi-component phytogenic blends is their resistance resilience. Because compounds such as saponins, tannins, essential oil phenols, and bitter glycosides act on multiple biological targets simultaneously – membrane integrity, cell adhesion, sporulation, immune activation, oxidative balance – the probability of Eimeria developing resistance to a well-formulated phytogenic blend is fundamentally lower than for single-target anticoccidials. As regulatory pressure on chemical anticoccidials increases globally, particularly in the EU, phytogenic integration offers a scientifically grounded pathway to sustainable, long-term coccidiosis management.Key message for integrators and veterinarians
The characterization of E. lata, E. nagambie, and E. zaria creates a non-negotiable gap in current vaccine-based control programs. No available commercial vaccine provides protection against these three new species. Phytogenic blends – specifically those combining saponins, tannins, thymol, cinnamaldehyde, and supporting compounds (cumin, licorice, etc.) – offer the only currently available broad-spectrum complementary tool capable of addressing this gap while simultaneously managing drug-resistant classical species.
6. Conclusions
The formal naming of Eimeria lata, Eimeria nagambie, and Eimeria zaria in 2021 represents the most significant taxonomic development in avian coccidiosis in decades. Beyond nomenclature, these new species present concrete operational challenges: they are pathogenic, performance-impairing, capable of global spread, and invisible to all currently available commercial vaccines and most routine diagnostic protocols.
This discovery reinforces the case for moving beyond single-mechanism control strategies. Phytogenic compounds, through their complementary and multi-target mechanisms of action, provide a scientifically validated layer of broad-spectrum coccidiosis management. The compound portfolio reviewed in this paper – saponins, tannins, thymol, cinnamaldehyde, cumin, licorice, etc. – collectively addresses direct parasite suppression, intestinal barrier protection, immune modulation, oxidative stress reduction, and secondary pathogen control. These mechanisms operate independently of vaccine-induced immunity and without the resistance trajectories associated with conventional anticoccidials.
As the global poultry industry adapts to a coccidiosis landscape that now includes ten recognized Eimeria species infecting chickens, phytogenic integration is no longer an optional enhancement – it is a fundamental component of resilient, future-proof flock health management.
For more information on EW Nutrition’s phytogenic solutions supporting coccidiosis control,
contact your EW Nutrition regional representative or visit ew-nutrition.com
References
Abbas, R.Z., Colwell, D.D., Gilleard, J. (2012). Botanicals: an alternative approach for the control of avian coccidiosis. World’s Poultry Science Journal, 68(2), 203–215.
Abbas, R.Z., Iqbal, Z., Blake, D., Khan, M.N., Saleemi, M.K. (2011). Anticoccidial drug resistance in fowl coccidia: the state of play revisited. World’s Poultry Science Journal, 67(2), 337–350.
Bafundo, K.W., Johnson, A.B., Mathis, G.F. (2020). The effects of a combination of Quillaja saponaria and Yucca schidigera on Eimeria spp. in broiler chickens. Avian Diseases, 64(3), 300–304.
Blake, D.P., Knox, J., Dehaeck, B., Huntington, B., Rathinam, T., Ravipati, V., Ayoade, S., Gilbert, W., Adebambo, A.O., Tiambo, C.K., Tomley, F.M. (2020). Re-calculating the cost of coccidiosis in chickens. Veterinary Research, 51, 115.
Blake, D.P., Marugan-Hernandez, V., Tomley, F.M. (2021). Spotlight on avian pathology: Eimeria and the disease coccidiosis. Avian Pathology, 50(3), 209–213.
Blake, D.P., Vrba, V., Xia, D., Jatau, I.D., Spiro, S., Nolan, M.J., Underwood, G., Tomley, F.M. (2021). Genetic and biological characterisation of three cryptic Eimeria operational taxonomic units that infect chickens (Gallus gallus domesticus). International Journal for Parasitology, 51(8), 621–634.
Cantacessi, C., Riddell, S., Morris, G.M., Doran, T., Woods, W.G., Otranto, D., Gasser, R.B. (2008). Genetic characterization of three unique operational taxonomic units of Eimeria from chickens in Australia based on nuclear spacer ribosomal DNA. Veterinary Parasitology, 152(3–4), 226–234.
El-Shall, N.A., Abd El-Hack, M.E., Albaqami, N.M., Khafaga, A.F., Taha, A.E., Swelum, A.A., El-Saadony, M.T., Salem, H.M., El-Tahan, A.M., AbuQamar, S.F., El-Tarabily, K.A., Elbestawy, A.R. (2022). Phytochemical control of poultry coccidiosis: a review. Poultry Science, 101(1), 101542.
Felici, M., Tugnoli, B., De Hoest-Thompson, C., Piva, A., Grilli, E., Marugan-Hernandez, V. (2024). Thyme, oregano, and garlic essential oils and their main active compounds influence Eimeria tenella intracellular development. Animals, 14(1), 77.
Ferdji, F., Zahraoui-Mehadji, M., Baazizi, R., Meghit-Boumediene, K. (2022). Anticoccidial drug resistance in Eimeria field isolates from broiler farms in western Algeria. Veterinary Parasitology: Regional Studies and Reports, 32, 100733.
Flores, M.I., Saldana, B., Orozco, M.M., Quijada, N.M., Bersosa, F., Mateo, E. (2022). Anticoccidial resistance to chemical compounds and ionophores in Eimeria field isolates from commercial broiler farms. Poultry Science, 101(11), 102180.
Hailat, A.M., Abdelqader, A.M., Gharaibeh, M.H. (2024). Efficacy of phyto-genic products to control field coccidiosis in broiler chickens. International Journal of Veterinary Science, 13(3), 266–272.
Jaramillo-Ortiz, J.M., Burrell, C., Adeyemi, O., Werling, D., Blake, D.P. (2023). First detection and characterisation of Eimeria zaria in European chickens. Veterinary Parasitology, 323, 109857.
Masood, S., Abbas, R.Z., Iqbal, Z., Mansoor, M.K., Sindhu, Z.U.D., Zia, M.A., Khan, J.A. (2013). Role of natural antioxidants for the control of coccidiosis in poultry. Pakistan Veterinary Journal, 33(4), 401–407.
Mesa-Pineda, C., Navarro-Ruiz, J.L., Lopez-Osorio, S., Chaparro-Gutierrez, J.J., Gomez-Osorio, L.M. (2021). Chicken coccidiosis: from the parasite lifecycle to control of the disease. Frontiers in Veterinary Science, 8, 787653.
Remmal, A., Achahbar, S., Bouddine, L., Chami, F., & Chami, N. (2013). Oocysticidal effect of essential oil components against chicken Eimeria oocysts. International Journal of Veterinary Medicine: Research & Reports, 2013, 599816.
Saeed, Z., Alkheraije, K.A. (2023). Botanicals: a promising approach for controlling cecal coccidiosis in poultry. Frontiers in Veterinary Science, 10, 1157633.
Sidiropoulou, E., Skoufos, I., Marugan-Hernandez, V., Giannenas, I., Bonos, E., Aguiar-Martins, K., Lazari, D., Blake, D.P., Tzora, A. (2020). In vitro anticoccidial study of oregano and garlic essential oils and effects on growth performance, fecal oocyst output, and intestinal microbiota in vivo. Frontiers in Veterinary Science, 7, 420.


 .
.