by David Sherwood, Managing Director EW Nutrition Oceania, and Christine Clark, Premium Agri Products
Colortek Yellow versus synthetic apo-ester: performance, stability, regulation, and market fit
Synthetic apo-ester has been the default yellow pigment in layer feed for decades. This axiom is no longer valid with current evidence. Regulatory caps in the EU, an outright ban in the US, and tightening scrutiny in ANZ are shrinking the headroom producers must work with. At the same time, consumer pressure toward natural ingredients continues to mount. Colortek Yellow, EW Nutrition’s marigold-derived yellow pigment, closes the performance gap that historically made natural alternatives unattractive. At 1.25 times the apo-ester dose it delivers equivalent yolk colour fan scores across all tested targets. It outperforms apo-ester on storage stability by a factor of 2.6 at three months, and it adds antioxidant protection that synthetic pigments cannot offer. This document sets out the evidence.
KEY NUMBERS
1. Why Yolk Colour Matters
Yolk colour is the most visible quality signal an egg sends. Consumers associate a deeper, richer yolk with a healthier hen and better nutrition. The practical consequence is that yolk colour directly influences purchasing decisions across retail and foodservice.
Preferences differ by market. Northern European consumers favour lighter yellows (YCF 9-10). Central and Southern Europe sits in the YCF 11-14 range. Japan pushes as high as YCF 18, a benchmark that Melinda Hashimoto, CEO of Egg Farmers of Australia, cited in the National Poultry Newspaper (March 2026) as a demonstration of what precise feed formulation and carotenoid management can achieve. As Australian producers look to Asian export markets, that benchmark becomes commercially relevant.
Colour is determined entirely by dietary carotenoids. Hens cannot synthesise these compounds. The pigments must be consumed in sufficient quantity, absorbed through a functional gut, transported in the bloodstream, and deposited in the developing yolk. Any failure along that chain, whether from poor pigment bioavailability, gut disruption, or hen stress, produces a pale yolk regardless of inclusion rate. This is why pigment source and hen health management are inseparable.
2. The Australian Industry Context
Australia’s egg sector is navigating the same global shift toward natural inputs that is reshaping feed additive markets in Europe and North America. The regulatory position on synthetic canthaxanthin in ANZ already reflects this direction: it is not a permitted food colouring under Standard 1.3.1, even though it remains available in layer feed without a stated maximum. That regulatory ambiguity creates commercial risk that natural alternatives avoid.
The biology of yolk pigmentation, and the two-phase process that produces it, is well understood by Australian nutritionists. Hashimoto’s March 2026 article in the National Poultry Newspaper described it clearly:
This two-phase model is exactly what Colortek Yellow (yellow base) and Xarocol (red shift) deliver as a paired natural program. Both products are already sold in Australia through Premium Agriproducts.
Hen health sits underneath all of it. When birds are under stress or fighting infection, carotenoids are diverted toward immune function and vitamin A synthesis rather than yolk deposition. A pale yolk can be a welfare signal as much as a nutrition one. Increasing synthetic pigment inclusion does not solve that problem. Choosing a high-bioavailability natural pigment, and managing flock health properly, does.
3. The Regulatory Landscape
Colortek is derived from marigold flowers, apo-ester is developed from a chemical manufacturing process. The direction of travel is consistent across all major markets: synthetic carotenoid additives face tighter controls; natural alternatives do not. Producers who build their pigmentation programs around synthetic apo-ester are exposed to a risk that compounds over time.
In the EU, Commission Implementing Regulation 2020/1400 set the maximum inclusion rate for apo-ester at 5 mg/kg complete feed for laying hens following a re-evaluation by EFSA. The authority could not rule out inhalation risk for workers, and simultaneous use in drinking water was prohibited to prevent cumulative xanthophyll limits being exceeded. These constraints reflect the scrutiny synthetic molecules now attract routinely, not exceptionally.
In ANZ, synthetic canthaxanthin sits in an awkward position: excluded as a food colouring but not subject to a stated maximum when used in layer feed. That gap will not stay open indefinitely. Switching to Xarocol, the paprika-based natural red pigment, removes the exposure entirely.
4. Performance: The Trial Data
The historical objection to natural yellow pigments was straightforward. Traditional marigold-derived lutein and zeaxanthin required roughly three times the inclusion rate of apo-ester to achieve the same yolk colour score, because intestinal absorption is lower. The economics did not stack up.
EW Nutrition’s proprietary production process changes that. By improving carotenoid bioavailability at the manufacturing stage, Colortek Yellow reduces the dose ratio to 1.25 to 1 against apo-ester. Two independent trials confirm the result holds in commercial conditions.
IRTA trial, Spain (288 Hy-Line Brown layers, 39 weeks)
Seven weeks of xanthophyll depletion followed by four weeks of treatment. Three yolk colour fan targets tested (YCF 10, 11, 12). Colortek Yellow tested at 1.25x the apo-ester dose. Statistical significance at P<0.05.
At 1.25x the apo-ester dose, Colortek Yellow matched apo-ester across all three targets. The trial also found that standard apo-ester dosing recommendations were overestimated, producing scores roughly one point above target. Producers may already be using more synthetic pigment than they need.
Field validation, Spain (57,000 hens)
Under commercial conditions at scale, Colortek Yellow at a 1.25:1 ratio produced equivalent yolk colour scores to apo-ester (12.5 versus 12.7). The laboratory result holds in the field.
5. Stability
Lower stability in premix storage has been a legitimate concern with natural pigments. EW Nutrition addresses this through an accelerated saponification process that produces a low-moisture, high-xanthophyll product. The difference at extended storage is substantial.
After three months, apo-ester retains 18% of active ingredient. Colortek Yellow retains 47%. For a premix manufacturer or feed mill running standard storage cycles, this is not a marginal difference. It means less product degradation between manufacture and use, more consistent on-farm results, and a lower effective cost per unit of pigmentation delivered.
6. Antioxidant Protection
Synthetic apo-ester is a synthetic colourant, only. Marigold-derived lutein and zeaxanthin colourants are also antioxidants, and that matters in the yolk because egg lipids oxidise readily, particularly during processing and extended retail.
Lutein and zeaxanthin also deposit in human tissue via consumption of enriched eggs, where their role in reducing cataract risk and age-related macular degeneration is documented (Landrum and Bone, 2001; Wang et al., 2016). This is the basis for functional egg positioning in premium markets, particularly in countries where antioxidant-enriched eggs are established retail categories.
7. Colortek Yellow: Product Specifics
Colortek Yellow is a 10% concentrated marigold extract produced at EW Nutrition’s FAMI-QS certified facility in Spain. Key characteristics:
Carotenoid source: Tagetes erecta (marigold) flower extract, lutein and zeaxanthin
Concentration: 10% active carotenoids
Dose ratio: 1.25:1 against synthetic apo-ester, confirmed in multiple independent trials
Stability: higher 3-month recovery than apo-ester under accelerated storage conditions
Physical form: free-flowing powder, homogeneous mixing in feed
Certification: FAMI-QS, EU manufactured, strict control of undesirable substances
Red pigment complement: Xarocol, paprika-based, natural alternative to synthetic canthaxanthin
Australian distribution: Premium Agriproducts
8. Summary
Synthetic apo-ester is under regulatory pressure in every major market and faces outright prohibition in others. The performance gap that previously justified its use has closed. Colortek Yellow delivers equivalent yolk colour at 1.25 times the dose, better stability at three months, and antioxidant protection that synthetic pigments cannot match.
For Australian producers, the benefits from use of natural pigments are supported by the current regulatory positions held on synthetic canthaxanthin and by the export opportunity in Asian markets where deep, consistent yolk colour from natural sources commands a premium. The Egg Farmers of Australia’s own guidance points to carotenoid source selection and hen health management as the foundations of a reliable pigmentation program. Colortek Yellow and Xarocol are built on exactly those foundations.
References
EU Commission Implementing Regulation 2020/1400, 5 October 2020.
Hashimoto, M. (2026). Egg yolk pigmentation: what drives colour and why it matters. National Poultry Newspaper, Vol 9 No. 3, March 2026.
Grashorn, M. (2008). Eiqualitat. In Legehuhnzucht und Eiererzeugung, Landbauforschung special issue 322.
Grashorn, M. (2016). Feed additives for influencing chicken meat and egg yolk color. In Handbook on Natural Pigments in Food and Beverages. Woodhead Publishing.
Landrum, J.T. and Bone, R.A. (2001). Lutein, zeaxanthin, and the macular pigment. Archives of Biochemistry and Biophysics 385(1):28-40.
Wang, W. et al. (2016). Antioxidant supplementation increases retinal responses in dogs. J. Nutr. Sci. 5 e18.
EW Nutrition internal trial data, IRTA Spain (288 layers) and commercial field trial (57,000 hens).
What happens to everything else if the food system fails? … And why we should make sure that doesn’t happen
by Ilinca Anghelescu, Global Director Marketing & Communications, EW Nutrition
Every week, a new story promises to change how we eat. Lab-grown steaks. Vertical farms fed by LED lights. Cricket flour. The algae revolution. Regenerative everything.
Meanwhile, somewhere in Iowa, a farmer is managing soil drainage at 4 a.m. In the Yangtze River Delta, flooded paddy fields are being leveled by laser-guided equipment. In the Sahel, sorghum is being harvested by hand under brutal heat. In the Netherlands, greenhouse engineers are coaxing eight tomato harvests a year from hydroponic systems. Such professionals, such practices are, collectively, the reason 8 billion people ate today.
How we got here, and why we cannot go back
The density problem nobody talks about
In his 2024 book How to Feed the World, Czech-Canadian professor and researcher Vaclav Smil notes that, across 300 forager societies that persisted into the 19th and 20th centuries, the mean population density was 0.25 persons per square kilometer.1 The most productive forager groups, those with access to salmon runs or seal hunting on Pacific coastlines, could reach just above one person per square kilometer. By contrast, intensive agricultural systems in southern China during the Qing dynasty supported more than 500 people per square kilometer of farmland.1 Contemporary industrial agriculture can support between 500-900.
In Smil’s analysis, agriculture is not slightly more efficient at feeding people than foraging. Agriculture is between 500 and 2,000 times more efficient than foraging.
Figure 1 Agriculture is between 500 and 2,000 times more efficient than foraging
The thought experiment Smil runs through disposes of several popular fantasies at once, including those in which humans go back to a primitive way of eating. For instance, an adult human eating like a chimpanzee (roughly 80 percent fruit by mass) would need four to five kilograms of ripe fruit daily, requiring hours of foraging and providing almost no fat or protein.1 To supply just the European Union’s 450 million people with adequate protein via this dietary route would require more than half a billion tons of figs per year, roughly 400 times the entire 2020 global fig harvest.1 The chimp model, like other primitive models (whether purely foraging or hunting or a mixed model), cannot scale.
In other words, in a world currently trying to feed 8.3 billion people, the transition to agriculture cannot be undone.
The rule of 20: Why we eat so few plants
One of the more counterintuitive facts in food systems science is how narrow our dietary base actually is. Botanists have classified nearly 400,000 species of vascular plants. Roughly 12,000 of those are grasses capable of producing nutritious seeds. Of these, humanity has domesticated a tiny fraction. Just 20 plant species account for 75 percent of all annually harvested crops by weight. Two of those species, rice and wheat, alone supply 35 percent of global food energy.1
This is not a failure of agricultural imagination but the result of stringent selection criteria that operated over thousands of years. Smil calls these criteria the “entry requirements” for staple crops: fast maturation, high yield, long shelf life, resistance to pests, and high energy density. Wheat, for example, contains roughly 350 kilocalories per 100 grams. Tomatoes contain fewer than 20 kcal/100g. Wheat is 18 times more energy-dense per unit weight.1
The early civilizations that independently discovered the cereal-legume combination (corn and beans in the Americas, rice and soybeans in Asia, wheat and lentils in the Middle East) were solving an amino acid optimization problem without knowing it. Cereals are low in the essential amino acid lysine. Legumes are high in it. Together, they provide a complete protein profile. The world’s great cuisines, from Mexican rice and beans to Japanese miso soup over rice, are not accidents. They are dietary solutions that natural selection, mediated through human survival and culture, arrived at over millennia.1
Figure 2 Mexican rice and beans provide a complete protein profile, optimizing for lysine availability
What the economy doesn’t count
The GDP illusion
In standard economic accounting, agriculture contributes roughly 1 to 4 percent of GDP in developed countries and somewhat more in developing ones. This number is cited constantly as evidence that farming is a residual sector, economically marginal, safely neglected in favor of “shinier” industries.
Smil dismantles this framing methodically. When you add food processing, food manufacturing, beverages, food retail, and food service, the food system in the United States accounts for approximately 5 percent of GDP and more than 10 percent of total employment.1 But even this number, broad as it is, underestimates the true scale, because it fails to capture the full infrastructure dependency: the fuel and energy consumed by agricultural machinery, the chemical industry built to supply fertilizer, the logistics networks dedicated to food transport and cold chain management, and the healthcare costs tied to diet-related disease.
When Smil attempts a full-system accounting of global food, including production, processing, transportation, wholesale, retail, storage, and consumption, he concludes that the food system’s true share of global economic activity is on the order of 25 to 30 percent of respective totals, with standard economic accounts attributing less than 5 percent representing “grossly inaccurate and highly misleading quantifications.”1
The energy picture is similarly startling. Smil calculates that the global food system consumes between 20 and 25 percent of the world’s annual primary energy supply.1 This includes the energy to grow, harvest, process, refrigerate, transport, package, cook, and dispose of food. It is the single largest category of energy use in human civilization, larger than personal transportation, larger than industrial manufacturing of most goods, and yet it rarely appears in climate policy discussions with the prominence its scale demands.
Smil offers one striking comparison that has only sharpened since his original analysis. The global smartphone market in 2024 generated approximately $441 billion in wholesale revenue, calculated from approximately 1.24 billion units shipped at a record average selling price of $356.34 In that same year, the global wheat harvest, some 799 million tons, was worth approximately $215 billion at reference export prices, and the global rice harvest of roughly 541 million tons was worth approximately $318 billion.32 33 Combined, just these two crops generated an estimated $533 billion, roughly 20 percent more than the entire global smartphone market. Two crops, grown on a fraction of Earth’s farmland, produced economic value that exceeds the most ubiquitous consumer technology device in human history.
Figure 3 The smartphone market failing would inconvenience billions of people. The wheat harvest failing would kill millions.
Revolutions usually come from empty stomachs
A history lesson worth remembering
The historical relationship between food insecurity and political instability is one of the most robustly documented relationships in social science. The French Revolution of 1789 was preceded by catastrophic grain harvests in 1788. Bread prices in Paris in early 1789 consumed up to 88 percent of a worker’s daily wage.2 The Arab Spring of 2010-2011 was triggered, at least in part, by a spike in global food commodity prices. Mohamed Bouazizi, the Tunisian street vendor whose self-immolation catalyzed a regional uprising, was a food vendor who had his produce confiscated.3
The research is consistent. A 2011 preprint study published by Marco Lagi and colleagues at the New England Complex Systems Institute found that global food price spikes, as measured by the FAO Food Price Index, were a consistent precursor to social unrest and political instability events across multiple continents.3 A 2015 paper in theAmerican Journal of Agricultural Economics extended this analysis, finding statistically significant relationships between cereal price levels and social unrest.4
The baseline condition for social order is that people have access to food. Everything else, including the liberal democratic institutions, the tech economies, and the climate negotiations that dominate contemporary policy attention, depends on that foundation being intact. Smil makes this point in structural rather than historical terms. When he asks whether smartphones or food matter more, the answer is obvious to him: “A world without smartphones would be poorer and less convenient. A world without food would not exist.”1
The 9%
According to the UN Food and Agriculture Organization, approximately 733 million people, roughly 9 percent of the global population, were undernourished in 2023.5 This is not primarily a production problem. As Smil notes and the FAO confirms, global food production averages around 3,000 kilocalories per person per day, which is substantially above the roughly 2,500 kilocalories required by an average active adult.15 The world produces enough calories to feed everyone.
The problem is access, poverty, and distribution. Hunger is a political economy failure, as price spikes hit the poor first and hardest. But if global food production fell by 10 percent, the 9 percent who are currently undernourished would not be the only ones suffering. Supply shocks ripple through markets and a globalized world does not allow for compartmentalized impact as much as it used to.
Figure 4 Caloric availability vs need: Comparing average daily kilocalorie supply per person by region against the standard requirement of 2,500 kcal.
The real environmental cost: Agriculture and alternatives
Some immediate problems have immediate solutions
Agriculture accounts for approximately 72 percent of global freshwater withdrawals.1 Cropland and permanent pastures together cover about 36 percent of non-glaciated land.1 The food system is responsible for approximately 34 percent of global greenhouse gas emissions, based on the most comprehensive analysis available.6 These figures are often presented as indictments. They should instead be understood as measures of necessity. The question is not “why does food production use so much?” but “what would we use it on instead, and would that work?”
The FAO’s global assessment of livestock’s climate impact, the famous 2006 report Livestock’s Long Shadow, attributed 18 percent of greenhouse gas emissions to livestock. A revised methodology in 2013, applying the same accounting framework used for other sectors, reduced this figure to approximately 14.5 percent.7
The nitrogen story is more nuanced. Smil notes that global nitrogen use efficiency (the share of applied fertilizer that ends up in harvested crop rather than escaping to air or water) averages around 40 percent globally, and has been falling in intensively farmed regions.1 In China, over-fertilization has driven efficiency from 37 percent down to 29 percent, with the difference escaping as nitrous oxide (a potent greenhouse gas), ammonia (an air pollutant), and nitrates (which contaminate groundwater and create coastal dead zones).1 This is a genuine problem with practical and affordable solutions: better timing of fertilizer application, matching fertilizer type to soil need, and precision agriculture technologies that reduce over-application.
The problems of industrial agriculture are, to a large extent, engineering problems. They have technical solutions that can be implemented incrementally, at scale, within existing agricultural systems. They do not require abandoning food production as we know it; they require improving it.
What “organic” actually means at scale
The appeal of organic farming as an environmental solution is real but its limits are underappreciated. A 2012 meta-analysis in Nature by Seufert and colleagues found that organic farming produces, on average, 25 percent lower yields than conventional farming across all crops, with the gap widening to 43 percent below conventional yields for some cereal crops.x8 A subsequent 2017 analysis in Agronomy for Sustainable Development by Lesur-Dumoulin and colleagues examining more than 50 studies found yield gaps of 19 to 25 percent, with significant variation by crop and region.x9
The implication is straightforward. Feeding the current global population on fully organic agriculture would require converting an additional 16 to 30 percent of the world’s remaining non-agricultural land to farmland, in order to compensate for lower yields.x10 The biodiversity loss from that land conversion would likely exceed the biodiversity gains from reduced pesticide use on existing farmland. This does not make organic farming in any way bad, it simply makes it a context-specific tool instead of a global solution.
Smil notes that in the centuries before synthetic fertilizers, when all farming was “organic” by definition, 80 percent of people worked in farming, doing physically exhausting work for marginal returns. The “liberation” of the majority of humanity from agricultural labor, one of the most profound quality-of-life improvements in history, was made possible by the Haber-Bosch process, the synthesis of ammonia from atmospheric nitrogen, invented in 1913. Without synthetic nitrogen fertilizer, global crop yields would fall by roughly 40 to 50 percent, and roughly half of the current human population could not be fed on existing farmland.x11
The alternatives don’t add up
Cultured meat: Promising, not a solution
The first cultured beef burger was produced in 2013 in the Netherlands at an estimated cost of $330,000.1 By 2020, Singapore approved the first commercial sale of cultured chicken nuggets, produced by Eat Just, at a price point still far above commodity chicken. By 2021, total investment in the sector had reached approximately $2 billion.1
The fundamental challenge is not biological but a matter of thermodynamics. Cultured meat production requires maintaining cells in a growth medium at controlled temperature and pH, with continuous oxygen supply, nutrient input, and waste removal. A 2023 preprint study by Risner and colleagues at UC Davis found that, under current production processes, the lifecycle greenhouse gas emissions of cultured beef could actually be higher than conventional beef over a 1,000-year time horizon, because the production of growth media requires large amounts of purified water and energy-intensive pharmaceutical-grade inputs.x12
The energy demand is particularly problematic. A 2019 analysis in Frontiers in Sustainable Food Systems by Lynch and Pierrehumbert (Oxford) found that cultured meat’s climate advantage over cattle depends heavily on whether energy production is decarbonized. Because cultured meat emissions are almost entirely CO₂ (which accumulates indefinitely) rather than methane, which breaks down within a decade, the long-term warming impact of cultured meat can exceed that of cattle under scenarios of continued high consumption. The energy advantage of cultured meat over monogastrics (pigs and poultry) is marginal at best and may reverse under realistic production conditions.”13
None of this means cultured meat has no future. It may eventually serve specific markets, particularly as a supplement to conventional production in regions where land is extremely constrained. But Smil’s verdict is clear: it is currently “pilot scale” technology, commercially unproven at mass market pricing, and it cannot meaningfully contribute to feeding up to 10 billion people in the next two to three decades.1
The vegan transition?
Beef is by far the largest emitter of CO2 equivalent per kilogram of protein, compared to chicken or pork.14 A diet shift from beef to other proteins in high-income countries would measurably reduce the food system’s climate impact.
But Smil flags an important caveat that often goes unmentioned in advocacy for plant-based diets: mass adoption of veganism in wealthy countries, if it leads to increased consumption of out-of-season fruits, nuts, avocados, and specialty protein crops, may not reduce and could even increase total environmental pressure.1 Almonds require approximately 12 liters of water per nut.15 Avocados, with their supply chains running from Mexico to Europe, have water footprints of approximately 320 liters per fruit and contribute to deforestation in growing regions.16
There is also a structural argument that rarely gets made: production animals serve functions beyond meat (and not even mentioning milk or eggs). Approximately 57 percent of current global livestock feed consists of materials that are not edible by humans: crop residues, grass from land unsuitable for cropping, and food processing byproducts such as oilseed cakes, bran, and distillers’ grains.17 Animals convert non-human-edible biomass into high-quality protein and fat. This is not waste but efficiency.
What Would Actually Work
First target waste
Global food waste amounts to approximately 1,000 kilocalories per person per day, roughly one-third of total food production.
The FAO estimates that approximately one-third of all food produced for human consumption, roughly 1.3 billion tons per year, is lost or wasted annually.18 Losses occur throughout the supply chain, from post-harvest spoilage in developing countries (where cold chain infrastructure is inadequate) to consumer behavior and retail overproduction in wealthy ones. The environmental cost of this waste is itself enormous: the production of food that is ultimately not eaten accounts for approximately 8 percent of global greenhouse gas emissions.19
Figure 5 Of all food produced, about a third is wasted at various points
The N fix that is already possible
Improving global nitrogen use efficiency (NUE) from its current 40 percent average to 60 to 65 percent, a target achievable through existing precision agriculture technologies (as mentioned before), would reduce the amount of synthetic nitrogen required to produce the current food output by roughly a third.20 This single change would decrease nitrous oxide emissions (which are 273 times more potent than CO2 over a 100-year timescale as a greenhouse gas, according to AR6, 2021 28), reduce freshwater nitrate contamination, and shrink coastal dead zones.
The technologies required are not exotic. Split nitrogen application (applying fertilizer in multiple smaller doses timed to crop uptake rather than one large dose at planting) can increase NUE by 15 to 20 percent with no change in yield.21 Soil testing and variable rate application technology, where GPS-guided equipment applies different fertilizer rates across a field based on measured soil nutrient levels, can improve NUE by a further 10 to 15 percent.22 These are available now, at commercially viable cost, for large-scale farming operations.
The barrier is not technical but rather economic and behavioral: fertilizer is cheap relative to its yield benefit, so farmers have limited financial incentive to apply it precisely. Policy tools, whether taxes on nitrogen over-application, payments for NUE improvements, or tighter limits on fertilizer application near waterways, could close this gap.
Meat mix and moderation
Smil estimates that approximately one-third of global cereal production and two-thirds of the US grain harvest are currently fed to animals.1 Feedlot beef carries a feed conversion ratio of roughly 30 kilograms of feed per kilogram of edible product at the high end.1 Poultry and pork convert feed to protein far more efficiently, and pasture-raised ruminants on land unsuitable for cropping represent a different calculation entirely.
The case for moderating high-end beef consumption in wealthy countries rests primarily on efficiency and emissions, not on the nutritional dispensability of meat as a food category. Meat, including beef, is a nutritionally dense and difficult-to-replicate protein source. It provides all essential amino acids in highly bioavailable form, along with heme iron, which is absorbed at rates of 15 to 35 percent compared to 2 to 20 percent for non-heme iron from plant sources, as well as zinc, vitamin B12, selenium, and conditionally essential compounds such as creatine and carnitine that are absent or negligible in unfortified plant foods.29 For populations in low- and middle-income countries where protein deficiency, iron deficiency, and micronutrient gaps remain widespread public health problems, the argument for reducing meat consumption requires a different cost-benefit analysis than it does in the United States or Northern Europe, where the concern is overconsumption rather than inadequacy.
The appropriate policy lever for high-income countries is therefore not elimination of meat categories but a shift in the composition of meat consumption toward more efficient and lower-emissions sources (more poultry and pork, less feedlot beef) while maintaining total protein adequacy. This is consistent with both the environmental evidence and updated dietary guidelines in major consuming nations. A 2016 analysis by Springmann and colleagues at Oxford, published in PNAS, found that transitioning toward diets in line with standard dietary guidelines could reduce global mortality by 6 to 10 percent and food-related greenhouse gas emissions by 29 to 70 percent compared with a 2050 reference scenario. 30 A subsequent 2018 modelling study by the same group in Nature confirmed that the dietary-guidelines scenario alone (without requiring full elimination of animal products) achieves a 29 percent reduction in food-related GHG emissions relative to projected baseline consumption.23 The gains are concentrated in high-income countries, and the modelling explicitly notes that applying the same dietary shift logic to low-income countries would in several cases increase land and water use rather than reduce it.31
Smil’s preferred framing holds: the goal is meat moderation and mix optimization, not categorical elimination.
What happens to everything else if the food system fails?
The answer is: everything collapses. Food insecurity at scale produces predictable cascades: political instability, refugee flows, conflict over resources, public health crises, and the breakdown of governance institutions that depend on social legitimacy. The Arab Spring, which reshaped the politics of a continent (and arguably the world), was triggered in part by a global food price spike following the 2010 Russian wheat export ban and droughts in major grain-producing regions.3
By contrast, the collapse of the smartphone market, while economically painful, would likely not produce famine, mass migration, or state failure. The collapse of social media platforms, though consequential for public discourse, would not endanger human life. The collapse of the global financial system, as catastrophic as the 2008 crisis demonstrated it could be, is survivable in ways that the collapse of food production is not.
Figure 6 A collapse of technology would alter society. A failure of the food system would endanger the stability of entire countries – or more.
The world needs to feed 9.7 billion people in 2050, according to the UN medium-population projection.24 The cultured meat industry cannot scale to meaningful market share within that timeframe under any realistic projection. Precision nitrogen management can, and is already beginning to, because it requires only incremental adoption of existing technology by existing farmers working existing land.
The nutritional transition that high-income countries have largely completed, from adequate calories to excess calories to dietary choice, is not yet available to much of the world’s population. Agricultural development policy that ignores this gradient would impose wealthy-world concerns on people or categories for whom adequate nutrition remains an unsolved problem.
Sustainability discourses must get priorities right
Food production is the prerequisite for everything else. Applying regulatory pressure to it without carefully calibrating the effects on output, price, and access is different in kind from applying regulatory pressure to other sectors. When a factory closes due to regulatory non-compliance, workers lose jobs and consumers pay more for a product. When a region’s agricultural capacity declines due to poorly designed policy, people go hungry.
The European Union’s Farm to Fork strategy, adopted in 2020, proposed reducing synthetic pesticide use by 50 percent and synthetic fertilizer use by 20 percent, while increasing organic farmland to 25 percent of total agricultural area, all by 2030.25 These are admirable environmental goals. But a 2021 analysis by Beckman and colleagues at the USDA Economic Research Service found that full implementation of the Farm to Fork targets would reduce EU agricultural output by 7 to 12 percent and increase consumer food prices by 5 to 11 percent.26 A JRC (Joint Research Centre of the European Commission) report from the same year found that global adoption of Farm to Fork-style policies would actually increase GHG emissions by up to 6 percent, because production displaced from Europe would move to regions with less efficient farming systems and weaker environmental controls.27
Agricultural environmental policy is essential; so is designing it carefully, with quantitative impact assessment, realistic timelines, and protections for the most vulnerable consumers.
What actually reduces food system emissions
The research literature on food system decarbonization converges on a consistent set of effective interventions, none of which involve dismantling existing agricultural production:
Reducing food waste. A 30 percent reduction in food loss and waste globally would reduce food system GHG emissions by roughly 8 to 10 percent.19 This is achievable through infrastructure investment (cold chains in developing countries), behavioral change (consumer education in wealthy ones), and regulatory reform (relaxing cosmetic standards for produce that create waste at the retail level).
Sustainable diets in high-income countries with a smart mix of protein sources, including poultry, pork, legumes, and dairy. Agriculture systems, including livestock production, should indeed operate at the lowest emissions level possible and with reduced antibiotic use to protect the environment, animals, and ultimately humans.
Improving agricultural productivity in low-income countries, particularly sub-Saharan Africa. Smil notes that average nitrogen application rates in sub-Saharan Africa are approximately 3 kilograms per hectare, compared to 50 kilograms in China and 30 kilograms in Europe.1 Increasing yields in Africa to levels achievable with modest fertilizer application and better seed varieties would allow the same food output from less land, reducing pressure on forests and biodiversity.
Improving nitrogen use efficiency in high-input farming systems through the technologies described earlier in the article.
None of these interventions require a technological revolution. They require investment, policy reform, and the political will to treat food production as the strategic priority it is.
References
1. Smil, V. (2024). How to Feed the World. Viking/Penguin Random House. (US edition 2025.)
2. Labrousse, E. (1944). La crise de l’économie française à la fin de l’Ancien Régime et au début de la Révolution. Presses Universitaires de France. Cited in McPhee, P. (2012). Liberty or Death: The French Revolution. Yale University Press.
3. Lagi, M., Bertrand, K.Z., & Bar-Yam, Y. (2011). The food crises and political instability in North Africa and the Middle East. New England Complex Systems Institute Preprint, arXiv:1108.2455. Available at: https://arxiv.org/abs/1108.2455
4. Bellemare, M.F. (2015). Rising food prices, food price volatility, and social unrest. American Journal of Agricultural Economics, 97(1), 1–21. https://doi.org/10.1093/ajae/aau038
6. Crippa, M., Solazzo, E., Guizzardi, D., Monforti-Ferrario, F., Tubiello, F.N., & Leip, A. (2021). Food systems are responsible for a third of global anthropogenic GHG emissions. Nature Food, 2, 198–209. https://doi.org/10.1038/s43016-021-00225-9
7. Gerber, P.J., Steinfeld, H., Henderson, B., Mottet, A., Opio, C., Dijkman, J., Falcucci, A., & Tempio, G. (2013). Tackling Climate Change Through Livestock: A Global Assessment of Emissions and Mitigation Opportunities. FAO. https://www.fao.org/3/i3437e/i3437e.pdf
8. Seufert, V., Ramankutty, N., & Foley, J.A. (2012). Comparing the yields of organic and conventional agriculture. Nature, 485, 229–232. https://doi.org/10.1038/nature11069
9. Lesur-Dumoulin, C., Malézieux, E., Ben-Ari, T., Langlais, C., & Makowski, D. (2017). Lower average yields but similar yield variability in organic versus conventional horticulture: a meta-analysis. Agronomy for Sustainable Development, 37, 45. https://doi.org/10.1007/s13593-017-0455-5
10. Ponisio, L.C., M’Gonigle, L.K., Mace, K.C., Palomino, J., de Valpine, P., & Kremen, C. (2015). Diversification practices reduce organic to conventional yield gap. Proceedings of the Royal Society B, 282, 20141396. https://doi.org/10.1098/rspb.2014.1396
11. Erisman, J.W., Sutton, M.A., Galloway, J., Klimont, Z., & Winiwarter, W. (2008). How a century of ammonia synthesis changed the world. Nature Geoscience, 1, 636–639. https://doi.org/10.1038/ngeo325
12. Risner, D., Kim, Y., Nguyen, D., Simons, C.W., & Spang, E. (2023). Preliminary techno-economic assessment of animal cell-based meat. bioRxiv. https://10.1101/2023.04.21.537778
13. Lynch, J., & Pierrehumbert, R. (2019). Climate impacts of cultured meat and beef cattle. Frontiers in Sustainable Food Systems, 3, 5. https://doi.org/10.3389/fsufs.2019.00005
14. Poore, J., & Nemecek, T. (2018). Reducing food’s environmental impacts through producers and consumers. Science, 360(6392), 987–992. https://doi.org/10.1126/science.aaq0216
15. Mekonnen, M.M., & Hoekstra, A.Y. (2010). The green, blue and grey water footprint of crops and derived crop products. Hydrology and Earth System Sciences, 15, 1577–1600. https://doi.org/10.5194/hess-15-1577-2011
16. Carrasco, L.R., Papworth, S.K., Reed, J., et al. (2017). High trade-offs between local and global demand for avocados. Nature Plants, 3, 1–3. See also Kibria, M.G., & Behrooz, M. (2022). Water footprint and environmental impact of avocado production. Sustainability, 14(2), 888.
17. Mottet, A., de Haan, C., Falcucci, A., Tempio, G., Opio, C., & Gerber, P. (2017). Livestock: On our plates or eating at our table? A new analysis of the feed/food debate. Global Food Security, 14, 1–8. https://doi.org/10.1016/j.gfs.2017.01.001
19. Intergovernmental Panel on Climate Change (IPCC) (2019). Special Report on Climate Change and Land (SRCCL). Chapter 5: Food Security. https://www.ipcc.ch/srccl/chapter/chapter-5/
21. Cassman, K.G., Dobermann, A., & Walters, D.T. (2002). Agroecosystems, nitrogen-use efficiency, and nitrogen management. AMBIO: A Journal of the Human Environment, 31(2), 132–140.
22. Robertson, G.P., & Vitousek, P.M. (2009). Nitrogen in agriculture: Balancing the cost of an essential resource. Annual Review of Environment and Resources, 34, 97–125. https://doi.org/10.1146/annurev.environ.032108.105046
23. Springmann, M., Clark, M., Mason-D’Croz, D., Wiebe, K., Bodirsky, B.L., Lassaletta, L., de Vries, W., Vermeulen, S.J., Herrero, M., Carlson, K.M., Jonell, M., Troell, M., DeClerck, F., Gordon, L.J., Zurayk, R., Scarborough, P., Rayner, M., Loken, B., Fanzo, J., Godfray, H.C.J., Tilman, D., Rockstrom, J., & Willett, W. (2018). Options for keeping the food system within environmental limits. Nature, 562, 519–525. https://doi.org/10.1038/s41586-018-0594-0
24. United Nations, Department of Economic and Social Affairs (2022). World Population Prospects 2022. UN DESA. https://population.un.org/wpp/
26. Beckman, J., Ivanic, M., Jelliffe, J.L., Burfisher, M.E., & Scott, S.M. (2020). Economic and Food Security Impacts of Agricultural Input Reduction Under the European Union Green Deal’s Farm to Fork and Biodiversity Strategies. USDA Economic Research Report EIB-30.
27. Barreiro-Hurle, J., Bogonos, M., Himics, M., Hristov, J., Pérez-Domínguez, I., Sahoo, A., Salputra, G., Weiss, F., Baldoni, E., and Elleby, C. (2021). Modelling environmental and climate ambition in the agricultural sector with the CAPRI model. JRC Technical Report EUR 30317 EN.
28. IPCC (2021). Climate Change 2021: The Physical Science Basis. Contribution of Working Group I to the Sixth Assessment Report of the Intergovernmental Panel on Climate Change. Cambridge University Press, Cambridge, United Kingdom and New York, NY, USA. https://10.1017/9781009157896
29. Estévez, M., & Rui Alves Soares, C. (2025). Nutrient equivalence of plant-based and cultured meat: Gaps, bioavailability, and health perspectives. Nutrients, 17(24), 3860. https://doi.org/10.3390/nu17243860
30. Springmann, M., Godfray, H.C.J., Rayner, M., & Scarborough, P. (2016). Analysis and valuation of the health and climate change cobenefits of dietary change. Proceedings of the National Academy of Sciences, 113(15), 4146–4151. https://doi.org/10.1073/pnas.1523119113
31. Springmann, M., Wiebe, K., Mason-D’Croz, D., Sulser, T.B., Rayner, M., & Scarborough, P. (2018). Health and nutritional aspects of sustainable diet strategies and their association with environmental impacts: a global modelling analysis with country-level detail. Lancet Planetary Health, 2(10), e451–e461. https://doi.org/10.1016/S2542-5196(18)30206-7
THE MIDDLE EAST CONFLICT: Implications for Feed & Animal Producers
by Ilinca Anghelescu, Global Director, Marketing & Communications
CRITICAL INTELLIGENCE SNAPSHOT
🚨 STATUS Hormuz DE FACTO CLOSED as of Feb 28, 2026
⚠ OIL PRICE ~$100+/bbl vs. $70 pre-crisis
📦 FREIGHT SURGE +250–500% Asia→Europe rates
🌾 GRAIN RISK 8% Global seaborne ag imports blocked
1. EXECUTIVE SUMMARY
The Middle East conflict has triggered one of the most significant and concurrent disruptions to agricultural trade, energy supply, and global logistics in recent history. For feed additive companies, the compounding effects of the Red Sea/Bab el-Mandeb closure, the newly disrupted Strait of Hormuz, rising oil prices, supply chain rerouting, and shifting demand patterns in the world’s fastest-growing feed markets constitute both immediate operational risk and medium-term strategic opportunity.
CRITICAL: As of February 28, 2026, the US–Israel joint military strikes on Iran have triggered an effective shutdown of the Strait of Hormuz. Maersk, MSC, Hapag-Lloyd, and CMA CGM have all suspended Gulf operations. This is now a TIER-1 supply chain emergency for the feed additive industry.
2. CONFLICT TIMELINE & ESCALATION PHASES
The current crisis is the product of nearly 30 months of sequential escalation. Understanding the timeline is essential for assessing the cumulative impact on the feed and animal nutrition industry.
Date
Event
Feed Industry Impact
Oct 7, 2023
Hamas attack on Israel; over 100,000 acres of Israeli farmland destroyed; >$500M in agricultural losses
Israeli livestock sector severely disrupted; poultry/egg farms destroyed in southern Israel
Nov 2023
Houthi rebels (Yemen) begin targeting commercial vessels in Red Sea; Bab el-Mandeb Strait under threat
Container shipping rerouted; freight rates begin rising; import delays for feed ingredients
Jan 2024
Red Sea tanker transits fall by 50%+ in first 2 months; major carriers reroute via Cape of Good Hope
Spot rates for Asia-Europe routes begin 5x increase; +10–14 days transit time for feed additive shipments
Apr 2024
Direct Iran–Israel missile exchange; war risk insurance premiums spike fiftyfold
Insurance surcharges add $700,000+ per cargo vessel transit; additive shipping costs escalate further
Jan 2025
Israel–Hamas ceasefire announced; limited Houthi de-escalation but attacks continue intermittently
Cautious optimism; some shipping carriers still avoiding Red Sea; safety stocks depleted by 2025
Jun 2025
12-day Israel–Iran air conflict; US bombs Iranian nuclear sites (Jun 21); Iran parliament votes to close Hormuz (Jun 23)
Oil prices briefly spike; grain insurance premiums rise; Brazil corn exports to Iran disrupted
CRITICAL DISRUPTION: 20% of global oil + 22% of global LNG + >8% of grain imports BLOCKED; oil at $100+/bbl; all Gulf port operations halted
Mar 3, 2026
Gulf states (UAE, Saudi Arabia, Qatar) face missile/drone attacks on ports; Jebel Ali, Khalifa Port affected; Suez Canal also suspended by CMA CGM
Regional feed additive distribution hubs (Dubai/Jebel Ali) at risk; last-mile delivery in Gulf nations severely disrupted
Sources: Al Jazeera (Mar 2026), CNBC (Mar 2026), Wikipedia – 2026 Strait of Hormuz Crisis, Arab Center Washington DC, Atlas Institute for International Affairs.
3. MARITIME CHOKEPOINTS: CRITICAL BOTTLENECKS FOR THE FEED INDUSTRY
3.1 The Red Sea / Bab el-Mandeb Strait (November 2023–Present)
The Bab el-Mandeb Strait – the southern entry to the Red Sea – connects the Gulf of Aden to the Indian Ocean. Prior to the conflict, it was the primary artery for Asia–Europe trade, facilitating approximately 15% of global maritime trade and nearly 30% of global container traffic. The humanitarian corridor also carried massive volumes of feed grains, feed additives, vitamins, amino acids, and raw materials from Asian manufacturers (predominantly Chinese) to European and Middle Eastern markets.
Metric
Pre-Crisis (Oct 2023)
Current Status (Mar 2026)
Suez Canal container transits
~50,000+ TEUs/week
Down 49–66%; most major carriers diverted
Asia–Europe container spot rate (40ft)
~$1,148
~$4,000–$6,000+ (250–500% increase)
Transit time Asia→Europe
Baseline
+10–14 days via Cape of Good Hope
Extra nautical miles (Cape reroute)
0
+3,500 nautical miles; +20 days round-trip
War risk insurance premium
~0.01% of vessel value
Up to 1%; ~50x increase
Average vessel delay
5.1 days (Nov 2023)
6.0+ days (Jan 2024); structural new normal
Houthi attack incidents
0
>190 attacks by Oct 2024; continues intermittently
Fuel cost increase (Cape reroute)
Baseline
+100 tonnes/day per container ship
Sources: OECD/ITF Red Sea Crisis Report 2024; Atlas Institute for International Affairs (Mar 2025); DocShipper (Jan 2026); Infor Nexus; Pangea Network (Feb 2024).
3.2 The Strait of Hormuz (February 28, 2026 – ACTIVE CRISIS)
STATUS AS OF MARCH 3, 2026: The Strait of Hormuz is experiencing an effective shutdown following US–Israel strikes on Iran on Feb 28, 2026. Iran’s IRGC issued VHF warnings to all vessels. Maersk, MSC, Hapag-Lloyd, and CMA CGM have suspended Gulf operations. This is the most severe maritime disruption in modern history.
The Strait of Hormuz is a 21-mile-wide waterway between Oman and Iran, with effective shipping lanes just 2 miles wide in each direction. It is the world’s most critical energy chokepoint and a vital import corridor for agricultural commodities into the Middle East Gulf (MEG).
Commodity/Trade Flow
Normal Daily Volume
Crisis Risk Level
Crude oil exports from Gulf
~20M barrels/day (20% of global supply)
CRITICAL – de facto blocked
LNG exports (Qatar/UAE)
22% of global LNG trade
CRITICAL – suspended
NGLs (propane, butane, ethane)
25.7% of global total
SEVERE – disrupted
Grain/oilseed imports into MEG
4.2% of global seaborne total
SEVERE – blocked
Fertilizer exports (MEG)
~1/3 of global fertilizer trade
SEVERE – disrupted
Container trade (Jebel Ali hub)
Major transshipment hub disrupted
CRITICAL – suspended
Feed additive distribution (Dubai)
Critical last-mile hub for ME/Asia
HIGH RISK – airport/port attacked
Sources: Kpler (Jun 2025); Al Jazeera (Mar 2026); CNBC (Mar 2026); US EIA; The Conversation (Mar 2026); Congress.gov CRS Report R45281.
Key Hormuz Alternative Routes: Pipeline alternatives exist but cover only ~17% of typical flow volumes:
Habshan–Fujairah Pipeline (UAE): Capacity ~1.5M bbl/day; limited impact on total disruption
For agricultural commodities: NO meaningful pipeline alternative exists; full rerouting via Cape of Good Hope is the only option
4. IMPACT ON ANIMAL PRODUCTION IN THE MIDDLE EAST
4.1 Regional Feed Market Context
The Middle East and Africa account for approximately 5.9% of world compound feed production, with ~75 million tons/year. The Middle East animal and pet feed market alone was valued at $53.2 billion in 2024, consuming 63 million tons. The region is a net feed importer, heavily dependent on seaborne commodities – a structural vulnerability now severely exposed.
Country
Feed Consumption 2024
Market Value 2024
Primary Species
Import Dependency
Turkey
14 million tons
$8.3 billion
Poultry, Ruminant
Moderate
Iran
13 million tons
$7.3 billion
Poultry, Ruminant
HIGH (corn, soy)
Saudi Arabia
9.1 million tons
~$5.5 billion
Poultry (54.6%)
VERY HIGH
Iraq
~5.1 million tons
$7.2 billion
Poultry, Ruminant
VERY HIGH
UAE
~3.2 million tons (393 kg/cap)
Significant
Poultry, Aquaculture
EXTREME
Egypt
Significant
Significant
Poultry, Cattle
HIGH
Sources: IndexBox (Dec 2025); Grand View Research (2024); Feed & Additive Magazine (2025); MarkNtel Advisors (2025).
4.2 Grain and Feed Import Vulnerability
The Middle East is the world’s largest importer of wheat and rice, and the second largest importer of corn. The Gulf Cooperation Council (GCC) countries are rated as food-secure by conventional metrics – but this masks extreme import dependency. The simultaneous closure of both the Bab el-Mandeb/Red Sea route and the Strait of Hormuz creates a near-complete sea access denial scenario for MEG grain imports.
The MEG accounts for ~4.2% of global seaborne agricultural bulk imports (corn, wheat, barley, soybeans) – about half sourced from Brazil and Argentina (Kpler, Jun 2025)
Iran imports ~4.3 million MT of corn annually from Brazil; in 2025 Iran was Brazil’s #1 corn destination at 24% of total exports (S&P Global, Jun 2025)
Iran’s seaborne agricultural imports fell 38% in 2024 from 2022 highs; the 2026 conflict will accelerate this decline sharply
Israel, entirely dependent on corn imports for feed and starch, saw poultry/egg farm destruction in the north and south; wheat stocks remain low (USDA GAIN, 2025)
Australia–Israel cattle shipments disrupted by Red Sea closure (USDA Israel Grain and Feed Annual, 2025)
A December 2024 UN report found 66.1 million people (~14% of the Arab region) faced hunger in 2023; projections for 2026 are materially worse
The simultaneous closure of both the Red Sea/Bab el-Mandeb and the Strait of Hormuz represents an unprecedented ‘double sea blockade’ scenario for Middle Eastern grain and feed importers. Gulf nations with food reserves of 3–6 months face acute shortages if the crisis extends beyond Q2 2026.
4.3 Specific Country-Level Animal Production Impacts
Israel
October 7 attacks destroyed >100,000 acres of farmland and caused >$500M in agricultural income losses (The Media Line, Oct 2024)
Poultry and egg production farms in northern and southern Israel destroyed by Hamas/Hezbollah actions; significant production decline
Labor crisis: up to 1/3 of Thai agricultural workers left immediately; Palestinian workers banned; volunteer-reliant harvest is not sustainable
Israel is entirely dependent on corn imports; barley feed use is reduced due to farm losses
Turkey – formerly among Israel’s top 5 exporters – imposed a full trade ban in 2024; chemical imports from Turkey collapsed from $16M/month to $2M/month
Iran
Iran’s corn imports from Brazil disrupted by rising insurance premiums, payment freezes, and wartime risks even before Feb 2026 escalation
With Hormuz effectively closed, Iran faces catastrophic domestic food supply disruption despite being a net energy exporter
Iranian livestock sector faces acute corn and soybean meal shortages; poultry and ruminant production under severe stress
Gulf States (Saudi Arabia, UAE, Kuwait, Qatar)
GCC countries are rated ‘high’ in food security indices – but are NOT immune to port blockades (World Economic Forum, 2025)
Jebel Ali (UAE) and Khalifa Port are major transshipment hubs for feed and additives serving broader ME/Asia markets – both now affected by missile/drone strikes
Saudi Arabia’s large-scale integrated poultry sector (top 7 producers control 87% of slaughter volume) relies entirely on imported corn, soy, and feed additives
Saudi Arabia’s Balady Poultry expansion plans (200M additional chicks/year) face acute disruption
5. FEED ADDITIVE SUPPLY CHAIN: RAW MATERIAL AVAILABILITY & COST IMPACT
5.1 Global Feed Additive Market Context
The global feed additives market was valued at $37.93–$57.82 billion in 2024 (multiple sources), projected to grow at 4.3–6.3% CAGR to 2032. The Middle East feed additives market reached $0.91 billion in 2025, forecast to grow at 3.2% CAGR to $1.07 billion by 2030. Amino acids dominate with 20.6% share; poultry accounts for 55.7% of volume – both sectors among the hardest hit.
5.3 The China Dependency Problem – Amplified by the Conflict
The Middle East conflict has dramatically amplified pre-existing structural vulnerabilities in feed additive supply chains – above all the heavy dependence on Chinese manufacturing.
The US relied on China for 78% of total vitamin imports and 62% of global amino acid production over 2020–2024 (IFEEDER, November 2025)
US poultry and livestock production uses >425,000 tonnes/year of the top four amino acids and ~50,000 tonnes of supplemental vitamins (AFIA)
Asia-Pacific (dominated by China) accounted for $14.46 billion of the global feed additives market in 2024
The Red Sea closure adds 10–14 transit days and up to $2,100/container in surcharges on shipments from Chinese ports to European or Middle Eastern destinations
A 40-foot container from China to Europe now costs ~$4,000–$6,000 vs. $1,148 pre-crisis – a 250–500% increase
US tariffs on Chinese feed additives of 25% (imposed 2024–2025) compound the logistics cost surge
Global capacity utilization for vitamins and amino acids has fallen below 80% – the threshold for financial stress on manufacturing viability, driving further price instability (IFEEDER, 2025)
At least 25% of studied vitamins and amino acids had production capacity that was underutilized or idle – including some categories at 20–30% utilization
STRATEGIC RISK: A single geopolitical shock to Chinese production capacity – coinciding with Middle East maritime disruption – would create a catastrophic supply gap for the global animal nutrition industry. The IFEEDER report warns: ‘even a small decline in supply of these important ingredients can have a huge impact on animal health and productivity.’
5.4 Israel’s Phosphate and Potash: A Secondary Supply Risk
Israel accounts for ~7% of global potash exports and ~3% of phosphate exports (Rabobank, 2023)
ICL (Israel Chemicals Ltd.), headquartered in Israel, is a major global supplier of phosphate and specialty fertilizers critical for feed-grade minerals
The primary potash/phosphate resources are in the Negev Desert, ~60 miles from Gaza – currently functioning, but with logistics risk
Turkey’s trade ban on Israel has disrupted chemical/mineral supply chains; imports of mineral products from Turkey to Israel fell from $13M to <$1M/month (US Trade.gov, 2024)
In a broader escalation scenario, ICL’s export capabilities could be disrupted, removing a significant share of global phosphate supply
5.5 Energy Costs: The Multiplier Effect on Feed Additive Production
Oil prices are the most important cross-cutting variable for the feed additive industry. Nearly all manufacturing inputs – fermentation energy, synthesis energy, transport – are sensitive to oil/gas prices. The Strait of Hormuz crisis has created a direct energy cost shock:
Oil Price Scenario
Estimated Price Range
Feed Industry Impact
Pre-conflict baseline (pre-Feb 2026)
~$65–75/bbl
Normal production costs; stable freight
Partial disruption (Red Sea only)
$75–90/bbl
+5–15% manufacturing energy costs; +25% freight surcharge
Current (Hormuz de facto closed)
$100–120/bbl
+20–40% energy costs; fertilizer nitrogen prices up significantly
Severe escalation (sustained Hormuz closure, 3+ months)
$130–150/bbl
+40–60% energy costs; amino acid fermentation costs surge; stagflationary impact on global economy
Catastrophic (tanker sinking, sustained blockade)
>$150/bbl or spike
Structural repricing of all manufactured additives; demand destruction
Source: World Bank Commodity Markets Outlook; Euronews (Oct 2023); Middle East Briefing (Mar 2026). Note: World Bank estimated every $10 sustained oil price increase reduces global GDP by 10–20 basis points.
6. TRADE FLOW CHANGES: IMPORTS, EXPORTS & ALTERNATIVE ROUTES
6.1 Major Trade Flow Disruptions for Feed & Feed Additives
Trade Route
Commodity Flow
Pre-Crisis Volume
Current Status
China → Middle East via Red Sea
Amino acids, vitamins, trace minerals, additives
~40% of Asia-Europe container trade via Suez
SEVERELY DISRUPTED – Cape reroute adds 14 days and 250% freight cost increase
Brazil/Argentina → Iran (Hormuz)
Corn (4.3M MT/yr), soybeans, sugar
Iran = 24% of Brazil corn exports in 2025
BLOCKED – Iran is Brazil’s #1 corn destination; shipments halted
Brazil/Argentina → Gulf States (Hormuz)
Corn, soybeans, soybean meal
MEG = ~4.2% of global seaborne ag imports
BLOCKED – both entry routes (Red Sea and Hormuz) compromised
Disrupted by Red Sea closure; alternative Pacific routing very costly
Israel → Brazil (fertilizers)
Potash, phosphate (1.2M MT; 4% of Brazil imports)
Regular trade flows
At risk – Turkey ban, logistics disruption; Brazil seeking alternatives
Sources: S&P Global Commodity Insights (Jun 2025); USDA GAIN Israel (2025); Merco Press (2023); Trade.gov (2024).
6.2 Alternative Routes Currently Being Used or Considered
Alternative Route
Extra Distance/Time
Cost Premium
Suitability for Feed/Additives
Cape of Good Hope (southernmost Africa)
+3,500 nm / +10–14 days
+$1,500–$2,100/container + fuel
NOW DE FACTO STANDARD for Asia–Europe–ME. Viable for dry goods (amino acids, vitamins, minerals). Capacity constrained; Mediterranean ports (Tanger Med, Valencia) congested.
Air Freight (for critical/high-value additives)
Days not weeks
5–10x sea freight
Viable for high-value, low-volume items (specialty enzymes, probiotics cultures, vitamin premixes). Not viable for bulk commodities. Stellantis already using; applicable for feed additive emergency supply.
Trans-Siberian Rail (China → Europe → ME)
+2–3 weeks vs. sea
Higher than normal sea; lower than Cape
Feasible for dry additives, specialty chemicals. Geopolitical risk given Russia-Ukraine. Limited capacity. Being explored by some EU importers.
India → Middle East Direct (Arabian Sea route, bypassing Hormuz)
Depends on origin
Variable
India’s own trade impacted (65% crude via Suez). For feed additives: Indian-origin amino acids (smaller scale) can supply Gulf via western Indian Ocean, avoiding Hormuz.
Turkey/Black Sea → Middle East (land/sea hybrid)
Variable
Variable; disrupted since 2022
Turkey trade ban on Israel complicates this. For other ME countries, Turkey-origin ingredients viable where relations intact.
Gulf Pipeline Routes (for energy only)
N/A – land pipeline
No freight premium but capacity limited
NOT applicable for feed additives. East-West Pipeline and Habshan-Fujairah handle oil only; no agricultural commodity alternative exists.
Nearshoring/Regional Sourcing
N/A – no transit
Higher unit cost initially
DSM-Firmenich opened premix/additives facility in Egypt (Sep 2024) – directly responding to ME supply risk. Strategic long-term solution.
Sources: DocShipper (Jan 2026); OECD/ITF Red Sea Crisis Report; Red Sea Crisis Update (Jan 2026); Mordor Intelligence (Oct 2025).
6.3 Port Congestion: Downstream Bottlenecks
The rerouting of vessels via the Cape of Good Hope has created significant congestion at western Mediterranean and Atlantic hub ports:
Barcelona experienced a 23.9% increase in container traffic due to Red Sea rerouting
Tanger Med (Morocco) handled an additional 9 million TEUs as a result of Cape rerouting
Jebel Ali (UAE) – the largest port in the Middle East and critical for regional feed additive distribution – is now under direct threat from Iranian missile/drone strikes (Mar 2026)
Port of Fujairah, a key bunker fuel and transshipment hub, has been referenced in UKMTO incident reports (Mar 2026)
Egyptian Suez Canal revenues have fallen dramatically; compounding Egypt’s economic fragility and potential for further regional instability
7. STRATEGIC IMPLICATIONS
7.1 Financial Impact Analysis
Cost Category
Estimated Impact
Detail
Freight cost increase
+$1,500–$2,100/container (Cape)
Cape reroute is now the only option for most Asia–Europe–ME shipments; costs pass through to product pricing
Insurance surcharges
Up to $700,000+ per vessel transit
War risk premiums at ~0.7–1% of vessel value; applies to both Red Sea and now Hormuz
Inventory carrying costs
+25–40% working capital requirement
Safety stock build-out now essential; financial cost of holding 60–90 days vs. typical 30-day supply
Energy costs (manufacturing)
+20–40% at current oil price
Amino acid fermentation and vitamin synthesis are energy-intensive; $100+/bbl oil adds directly to COGS
Forex/payment risk (Iran)
High – Iran transactions frozen
Insurance, payment difficulties, and sanctions risk have effectively stopped trade with Iran
7.2 Demand-Side Effects: Reduced vs. Increased Additive Demand
Market Segment
Demand Effect
Driver
Israel – Poultry/egg
DECREASED (-30 to -50% estimated)
Farm destruction, labor shortage, reduced feed production
Total humanitarian/agricultural collapse; no commercial market
Saudi Arabia/UAE – Poultry
AT RISK (SEVERE)
Dependence on imported feed grains now blocked; production threatened
Egypt – Feed industry
MODERATELY NEGATIVE
Red Sea rerouting adds cost; economic pressure
Turkey – Feed industry
MODERATELY NEGATIVE to NEUTRAL
Geopolitical pivot away from Israel trade; economic pressure but domestic production continues
EU/North America – Alternative additive demand
POTENTIAL INCREASE
Supply tightness for China-origin additives may favor EU/US-produced alternatives; ‘friend-shoring’ push
Asia (ex-China) – Additive demand
INCREASE
India, Vietnam, Thailand expanding production; seeking non-China supply alternatives
7.3 Regulatory and Geopolitical Trade Complications
Turkey’s blanket import/export ban on Israel has created a significant precedent; further countries may impose quiet embargoes as the Iran conflict widens
US tariffs of 25% on Chinese feed additive imports (effective 2024–2025) add a regulatory layer on top of the logistics cost surge
EU regulatory push toward antibiotic-free production is increasing demand for acidifiers, probiotics, and phytogenics – growth segments still viable but supply-constrained
The IFIF (2024) found that strategic diversification of ingredient sourcing can reduce supply disruption risks by up to 40% – a clear strategic imperative now
The AFIA-supported ‘Securing American Agriculture Act’ specifically targets vitamin/amino acid dependency on China; similar EU initiatives are underway
8. SCENARIOS & FORWARD OUTLOOK (2026–2027)
Based on the current military situation as of March 3, 2026, and historical precedents for similar maritime crises, three scenarios are modeled:
Parameter
Scenario A: De-escalation (12–18 months)
Scenario B: Prolonged Conflict (18–36 months)
Scenario C: Catastrophic Expansion (>36 months)
Probability
25%
55%
20%
Hormuz status
Reopened in 3–6 months following diplomatic deal
Intermittent disruption; de facto restricted for 18+ months
Sustained effective closure or physical interdiction; tanker sinking scenario
Oil price
Returns to $70–80/bbl
Sustained $90–110/bbl
$120–$150+/bbl
Freight rates
Partially normalize
Remain elevated +150–200% vs. pre-crisis
+300–500% structural increase
ME feed demand
Partial recovery in H2 2026
Contracted by 15–25%
Contracted by 30–50%; food security crisis
Feed additive pricing
+10–20% sustained uplift
+25–40% sustained
+40–70%; demand destruction
Supply chain strategy
Rebalance stocks; maintain Cape routing
Accelerate nearshoring; dual-source everything
Emergency protocols; government procurement; force majeure activation
Recommended posture
Build safety stock; lock in contracts
Invest in regional manufacturing; diversify urgently
Note: As of March 3, 2026, Scenario B is the most likely base case. The ongoing ceasefire status of the Hormuz crisis remains uncertain; Iran has not formally closed the strait but effective vessel transit has halted.
9. STRATEGIC RECOMMENDATIONS FOR INDUSTRY STAKEHOLDERS
9.1 Immediate Actions (0–90 Days)
DECLARE SUPPLY CHAIN EMERGENCY STATUS: Convene crisis team; identify all Gulf-region inventory positions; audit vendor exposure to Hormuz-dependent routes
INVENTORY BUILD: Target 90–120-day safety stock for critical amino acids (methionine, lysine, threonine) and vitamins (A, D3, E, B-complex) sourced from Chinese manufacturers – previously 30 days was standard; safety buffers have been exhausted (Hillebrand Gori, Dec 2025)
CONTRACT LOCK-IN: Negotiate long-term (12–18 month) supply contracts with European-based manufacturers to reduce China routing dependency
ACTIVATE ALTERNATIVE SOURCING: Identify Indian, Korean, or other Asian manufacturers for amino acid intermediates; note that Indian capacity is smaller but available without Hormuz dependency
CUSTOMER COMMUNICATION: Proactively notify Gulf and ME customers of supply risk
REVIEW ALL IRAN POSITIONS: Freeze new commercial exposure; review accounts receivable; engage legal counsel on force majeure clauses in active contracts
9.2 Medium-Term Actions (3–12 Months)
NEARSHORING/REGIONAL MANUFACTURING: Evaluate establishing or partnering for a blending/premix facility in Morocco, Egypt, or Turkey to serve ME/African markets without Hormuz or Red Sea dependency
SUPPLY DIVERSIFICATION: Per IFIF (2024), strategic diversification of ingredient sourcing can reduce supply disruption risk by up to 40% – set a hard target of reducing single-country sourcing above 50% for any critical raw material
DUAL-ROUTING STRATEGY: Qualify Cape of Good Hope as permanent primary routing for all China-origin materials; do not assume Red Sea route will normalize immediately
FREIGHT HEDGING: Explore container freight rate hedging instruments; build surcharge recovery clauses into all forward customer contracts
REFORMULATION SUPPORT: Offer technical service to customers facing feed cost inflation – precision amino acid formulation, reducing excess protein use, enzyme programs to unlock nutrition from lower-cost local ingredients
DIGITAL SUPPLY CHAIN INVESTMENT: Invest in real-time supply chain visibility tools (ETA monitoring, alternative route optimization, insurance cost tracking)
FRIEND-SHORING: Align sourcing with geopolitically stable allies; prioritize EU, Brazil, India as long-term supply partners – less exposed to specific risks
FOOD SECURITY POSITIONING: Middle Eastern governments (Saudi Arabia 2030 Vision, UAE, Qatar) are heavily investing in domestic food security – position your company as a strategic partner for this transition, not merely a supplier
PRODUCT PORTFOLIO EVOLUTION: The crisis accelerates demand for precision nutrition (lower inclusion rates, higher efficacy), sustainability credentials (reduced environmental footprint), and antibiotic alternatives – invest R&D accordingly
TURKEY OPPORTUNITY: Turkey remains the largest ME feed market (14M tons/year); its geopolitical independence from the ME conflict and improving relations with Gulf states make it a strategic distribution hub
This report has been prepared for internal management purposes only. All data, figures, and market assessments are sourced from publicly available third-party reports and news sources as of March 3, 2026. The geopolitical situation described is highly fluid and subject to rapid change. This document does not constitute financial, legal, or investment advice. The organization should verify critical supply chain data with direct suppliers and logistics partners before making operational decisions.
The lessons of 2025 for poultry and feed producers
by Ilinca Anghelescu, Global Director Marketing & Communications, EW Nutrition
2025 was a year defined by four converging forces for the global feed and animal production industry: an unprecedented HPAI crisis that cost American consumers alone $14.5 billion extra in egg expenditures; historic record corn production driving feed ingredient prices lower; a highly disruptive US tariff regime that reshuffled global trade flows for soybeans, corn, chicken, and pork; and accelerating regulatory pressure on antimicrobial use across Europe and globally.
The strategic imperatives from 2025 are clear: biosecurity investment is no longer optional, ingredient price volatility demands agile procurement strategies, trade compliance is a weekly operational concern, and antibiotic-free production transitions require credible, phased plans now.
KEY METRIC: Global chicken meat production reached approximately 105 million MT in 2025 (+2%), even as egg production suffered severely. The global feed market is valued at $542 billion in 2025, growing at 3.3% CAGR. Corn hit record production of 17 billion bushels in the US alone – the highest since 1936 in terms of harvested area.
The H5N1 clade 2.3.4.4b strain of Highly Pathogenic Avian Influenza (HPAI) continued to dominate animal health headlines in 2025. Since its reemergence in February 2022, the US outbreak alone has resulted in the confirmed loss of over 175 million birds across 1,700+ flocks – the costliest poultry disease event in recorded history.
Metric
Data Point
Source
Total US birds affected (2022–2025)
175+ million
USDA APHIS, May 2025
US flocks confirmed positive
1,704+
USDA APHIS, May 2025
Proportion of affected birds: layers
75%
USDA / Congressional Research Service
US egg layer flock deficit vs. 2022
–8% fewer birds
CoBank / USDA
Consumer egg overspend (May 2024–Apr 2025)
$14.5 billion extra
Innovate Animal Ag analysis
Peak US retail egg price
$6.23/dozen (March 2025)
BLS / USDA
HPAI-related US taxpayer response costs
$1.8 billion+
Innovate Animal Ag
Global HPAI mammal outbreaks (2024)
1,022 (vs. 459 in 2023)
WOAH 2025
Countries self-declaring HPAI freedom (May 2025)
25
WOAH
1.2 2025-Specific Developments
United States: Early-Year Severity, Policy Response
The first six weeks of 2025 saw 28 million layers depopulated – the worst start to any calendar year on record. Ohio, Indiana, and Missouri bore the brunt. The USDA launched a five-pronged approach in February 2025 including:
Gold-standard biosecurity assessments (948 completed Jan 20–June 26)
Indemnity increase from $7 to $17 per lost layer hen
Importation of 26+ million dozen shell eggs from Brazil, Honduras, Mexico, Turkey, and South Korea
Removal of select regulatory burdens to accelerate flock repopulation
$793 million in HPAI research proposals received in response to USDA Innovation Grand Challenge
⚠ Price Manipulation Investigation: In April 2025, the DOJ Antitrust Division launched an investigation into the largest US egg producer after it reported a 247% increase in quarterly net income. Egg producers and retailers face ongoing scrutiny over whether crisis pricing exceeded what supply constraints warranted.
Brazil: First Commercial HPAI Outbreak – May 2025
On May 15, 2025, Brazil – the world’s largest poultry exporter, responsible for nearly 30% of global exports – confirmed its first-ever commercial HPAI case at a breeder facility in Montenegro, Rio Grande do Sul (17,000 birds). This was a watershed event for global poultry trade.
Consequence
Detail
China (#1 buyer of Brazilian chicken) suspended imports
Trade suspended as of May 2025; Chinese delegation visited RS in Sept 2025 to assess resumption
Brazil’s monthly poultry exports declined
Exports fell 12.9% to $655 million; volume down 14.4% to 363,100 MT (May)
UAE replaced China as Brazil’s top buyer
First time China dropped from #1 buyer since 2019
WOAH new 10-year global HPAI strategy launched
Prevention and Control of HPAI (2024–2033), February 2025
Regionalized trade bans helped contain damage
Bans limited to affected regions, not all of Brazil
Europe: Persistent Pressure
HPAI continued to circulate widely in European poultry and wild bird populations. Key 2025 events include recurrence in Australia (February), ongoing outbreaks in Germany, Hungary, Netherlands, UK, and France, and the first confirmed domestic cat HPAI death in the Netherlands (H5N1, November 2025).
CRITICAL RISK: HPAI is now classified as enzootic (endemic) in wild birds across North America by the CDC. The virus circulates year-round in wildlife reservoirs, making seasonal recurrence in commercial flocks a structural, not episodic, risk. US egg producers are 8% below their 2022 flock baseline.
EU-wide – statistically significant increase trend 2020–2024 per EFSA/ECDC joint report, March 2025
AMR pressure in broilers and layers; genomic surveillance being mandated by EU
Newcastle Disease (NCD)
Brazil – outbreak July 2024, RS state
First commercial NCD in Brazil since 2006; adds biosecurity burden on top of HPAI protocols
H5N1 in Dairy Cattle (USA)
Ongoing – cross-species spread to 50+ US states
Cattle-to-poultry transmission confirmed; biosecurity interfaces between dairy and poultry operations must be reviewed
HPAI – Antarctica
First confirmed case March 2024 (South Polar Skua)
Indicates virus reached every continent; unprecedented in poultry disease history
CHAPTER 2: GLOBAL POULTRY PRODUCTION
2.1 Global Output – 2025 Performance
Despite HPAI disruptions, global chicken meat production grew approximately 2% in 2025 to around 105 million MT (ready-to-cook), driven by demand resilience and lower feed costs for broiler production. Total global poultry meat (including turkey, duck, and others) is forecast to exceed 152 million MT for 2025, per FAO Food Outlook June 2025.
Country / Region
2025 Production Forecast (MT)
Year-on-Year Change
Key Driver
USA – Broilers
21.7 million MT
+1.4% vs. 2024
Strong hatchery data; lower feed costs; HPAI minimal in broilers
Affordability vs. beef; consumer demand in developing markets
OECD-FAO 10-Year Outlook (2025–2034)
The OECD-FAO Agricultural Outlook 2025–2034, released in July 2025, projects global poultry meat production will grow by over 19% to 173.4 million MT by 2034 compared to the 2022–24 average. Poultry will account for the majority of additional meat consumption globally, driven by:
Affordability relative to beef and pork, especially in price-sensitive emerging markets
Population and income growth in Southeast Asia, South Asia, and Sub-Saharan Africa
Rapid urbanization and expansion of Quick Service Restaurant (QSR) chains
Superior feed conversion ratio (FCR) and lower greenhouse gas emissions per kg of protein
STRATEGIC NOTE: In high-income countries, per capita poultry consumption growth is flattening as consumers focus increasingly on welfare, environment, and health attributes. Growth opportunity is almost entirely in middle-income markets. Product premiumization (antibiotic-free, cage-free, organic) is the North American and European story.
2.2 Egg Production – Crisis Sector
Egg production was the sector hardest hit by HPAI globally. In the US, 75% of all HPAI-affected birds were table-egg layers, despite layers comprising less than 4% of the total poultry population. This structural vulnerability reflects longer flock lifespans and, increasingly, cage-free housing adoption.
Indicator
2025 Data
US retail egg price peak
$6.23/dozen (March 2025)
US retail egg price decline from peak
–27% by June 2025 (wholesale –64%)
US retail egg price (January 2025)
$4.95/dozen – 96% higher than January 2024
USDA full-year 2025 egg price forecast
+41.1% vs. 2024 average
% of US laying flock in cage-free systems
~40% (120+ million birds)
Global hen egg production (2023 baseline)
91 million tonnes (~1.7 trillion eggs)
Global egg trade volume (2024)
Nearly doubled from prior years
⚠ Cage-Free Transition & Disease Vulnerability: Some analysts link cage-free housing to higher HPAI susceptibility. Regardless of epidemiological debate, the US cage-free market is now structurally undersupplied relative to corporate commitments made in 2014–2017. Producers face a squeeze: comply with welfare commitments while managing disease risk.
CHAPTER 3: FEED INGREDIENT MARKETS
3.1 Grain & Oilseed Prices – 2025 Summary
From a feed cost perspective, 2025 was broadly favorable for livestock and poultry producers. Record US corn production and generally adequate global grain and oilseed supplies put downward pressure on the major feed commodities, offering partial relief from the margin pressure of recent years.
Commodity
2025 Price Direction
Key 2025 Data
Implication for Feed
Corn (US)
DOWN –3.9% (3rd consecutive annual decline)
Record US crop: 17.0 billion bu; yield 186.5 bu/acre – record; harvested area highest since 1936
Favorable for poultry/swine FCR cost; season avg ~$4.15/bu projected
Soybean Meal
DOWN –4.3% (3rd consecutive decline)
Prices at lowest since early 2016 at one point; large South American supply weighing on markets
Significant reduction in diet protein cost; amino acid supplementation cost-competitive
Soybeans
UP slightly +3.3%
After 22.9% collapse in 2024; still well below historical peaks; US acreage declining
Bean oil +20.8% (energy diet component); meal-to-bean ratio remains attractive for crushers
Wheat (Chicago)
DOWN –4.3% (4th consecutive year)
Abundant global supply; Russia/Argentina record crops; increased feed use
Wheat competing with corn in feed formulations globally – inclusion rising in EU/Asia diets
Soybean Oil
UP +20.8%
Driven by biofuel demand (US 45Z renewable fuel credits)
Energy ingredient cost pressure; may affect fat inclusion rates in formulations
PROCUREMENT SIGNAL: The US/China trade tensions created windows of soybean buying opportunity as prices swung on trade deal news. China agreed to purchase US soybeans in late 2025 as part of a limited trade deal, causing a price uptick. Procurement teams should monitor US-China negotiations as a lead indicator for soybean pricing in 2026.
3.2 Global Feed Market Overview
Metric
2025 Data
Global animal feed market value
$542.36 billion
CAGR (2026–2034)
3.3%
Largest feed segment by additive type
Amino acids (33.6% share)
Largest feed segment by species
Poultry (dominant share)
Asia Pacific regional status
Dominant region (largest market)
Top feed ingredient challenge
Fluctuating prices for corn, SBM – still key risk for margin management
3.3 Key Ingredient Trends to Watch
Fertilizer Cost Relief
Fertilizer prices have declined significantly from their 2022 peak. A basket of N, P, and K fertilizers averaged $437/tonne in May 2025, down from the $815/tonne peak in April 2022, per FAO Food Outlook. This benefits grain production economics and should support adequate grain supplies into 2026.
Soybean Oil Competition: Biodiesel vs. Feed
US soybean oil demand from renewable fuel programs (the 45Z credit) competed directly with feed-grade fat supplies, pushing soy oil prices up 20.8% in 2025. Feed mills formulating with added fats should evaluate alternative lipid sources. Poultry fat and palm olein remain cost-competitive in some markets.
Alternative Proteins: Insect Meal, DDGS, Algae
While adoption remains limited in volume, regulatory acceptance of insect meal in EU poultry diets continues to expand. Dried Distillers Grains with Solubles (DDGS) remain a strategically important co-product, particularly in the US and EU. Feed formulators should have up-to-date matrix values and be prepared to use them when corn prices favor inclusions.
⚠ Tariff Risk for Feed Inputs: US feed manufacturers faced effective tariff rates averaging 12%+ on key agricultural inputs from China and other countries in 2025, including herbicides, pesticides, and some micro-ingredient precursors. Amino acid supplies (predominantly Chinese-origin lysine, methionine, threonine) faced added cost and supply uncertainty.
CHAPTER 4: TRADE POLICY DISRUPTIONS
4.1 The 2025 US Tariff Regime – Agricultural Impact
The Trump administration’s tariff policies beginning January 20, 2025, represented the most significant disruption to global agricultural trade in decades. The three largest US agricultural export markets – Mexico ($30.3B in 2024), Canada ($28.3B), and China ($24.7B) – were all targeted, triggering retaliatory measures that hit feed, grain, poultry, and pork exports.
Country
US Tariff (2025)
Retaliation on US Agriculture
Key Products Impacted for Feed/Poultry Industry
China
Reached 145% (paused to 30% via May 2025 truce)
15% on chicken, corn, wheat; 10% on soybeans, sorghum, pork – applied from March 2025
Chinese poultry buyers shifted away from US; US corn/soy export disruption; amino acid supply chain uncertainty
Canada
25–35% (escalated to 35% in Aug)
25% on US dairy, poultry, meat products ($21B)
Canada imports ~45% of US poultry exports; feed grain flows affected
Mexico
25–30% (USMCA-compliant goods largely exempted)
Retaliatory tariffs threatened on agricultural goods
Mexico is #1 market for US turkey exports; ongoing uncertainty
EU
14% (paused under negotiations)
Planned retaliation announced April 2025
Potential impact on US soy meal exports; EU feed ingredient costs
CHINA TRADE DEAL (MAY 2025): A 90-day tariff truce agreed May 12, 2025 reduced US tariffs on Chinese goods from 145% to 30%, and China’s tariffs on US products from 125% to 10%. China agreed to purchase US soybeans. No permanent deal was signed. The limited agreement provided short-term stability but medium-term uncertainty remains.
4.2 Impact on US Agricultural Trade Flows
Product
Trade Flow Change (2025)
Implication
Corn exports
UP >20% YoY
Record US production driving export competitiveness despite tariff uncertainty
Soybean exports
DOWN – China shifted to South America
Brazil and Argentina taking larger share of Chinese soy imports
US chicken exports
Maintained overall (6.8B USD)
Despite China restrictions, other markets (Middle East, Mexico) absorbed volume
US turkey exports
At risk – 10% of production exported; Mexico = 65% of turkey exports
HPAI + AMPV supply squeeze threatened export volumes at peak holiday season
Brazil chicken exports
Down 12.9% month of May impact; year-end positive
HPAI disruption in May/June; recovery in H2 2025 after regionalization
US egg imports (temporary)
26M dozen shell eggs imported
Emergency imports from Brazil, Honduras, Turkey, South Korea, Mexico to fill supply gap
4.3 Strategic Trade Lessons
Supply chain diversification is no longer a luxury: concentration of US soy exports to China created a single-point-of-failure vulnerability that became fully exposed in 2025.
Regionalized disease zoning is a trade-preserving tool: Brazil’s rapid implementation of regionalized HPAI bans (rather than country-wide) preserved most of its export access; this is the model the industry should support with regulators globally.
USMCA dependency is real: 70% of US corn, 60% of soybeans, 45% of poultry exports go to Mexico, Canada, China – the same three countries targeted by 2025 tariffs.
US government announced $12B in emergency farm compensation in 2025, repeating the pattern from Trump’s first term – indicating persistent trade disruption risk.
In 2025, the European Commission proposed a package to streamline EU food and feed safety legislation while maintaining high health standards. The initiative, announced mid-2025, is intended to boost competitiveness of EU producers by reducing regulatory complexity – a direct response to competitive concerns vs. non-EU producers.
5.2 EFSA 2025 Guidance on Microorganisms
On September 24, 2025, EFSA’s Scientific Committee adopted new harmonized guidance on the characterization of microorganisms in the food chain. This is a landmark shift with major implications for feed additive manufacturers, probiotics suppliers, and novel food applicants.
Key Element
Operational Implication
Whole Genome Sequencing (WGS) now mandatory for strain-level ID of all bacteria, yeasts, fungi, viruses in applications
All existing microbial feed additive dossiers must be reviewed; WGS data cannot be more than 2 years old at time of submission
Genomics-first approach to AMR assessment
Any AMR gene hit in curated databases triggers mandatory case-by-case assessment; significantly raises the regulatory bar for probiotics and fermentation products
Replaces multiple previous guidance documents
Companies must align R&D, QC, and regulatory documentation to new unified standard immediately
GM microorganisms: clearer differentiation
Products ‘produced by GMO’ now distinguished from ‘GMO active agents’ – critical for enzyme and probiotic positioning
Non-compliance = application rejection risk
Early non-alignment causes ‘clock-stops’ or formal rejection at EFSA suitability check stage
AMR remains the defining long-term regulatory risk for the animal feed and production industry. Key 2025 actions:
EFSA/ECDC Joint Report (March 2025): Highlighted persistently high resistance to critical antimicrobials in poultry, especially Campylobacter and Salmonella, with ‘statistically significant increasing trend 2020–2024.’ This directly fuels EU legislative pressure.
EU Regulation 2019/6 (Veterinary Medicines) – Article 118: Banning import of animal products containing antimicrobials used for growth promotion. Application delayed to 2026, raising questions about enforcement timelines – and competitive fairness regarding imports from countries still allowing AGPs.
EU AMR Implementation Decision 2023: New harmonized monitoring requirements for AMR in zoonotic and indicator bacteria from food-producing animals – effective January 1, 2025. All EU Member States now required to collect and report standardized AMR surveillance data.
WOAH 10-Year HPAI Strategy (2024–2033): Promotes surveillance, vaccination programs, and timely reporting as cornerstones of international HPAI management.
BOTTOM LINE ON AMR: The regulatory trajectory is clear and irreversible – sub-therapeutic antibiotic use for growth promotion is being eliminated globally. The timeline varies by region (already banned in EU since 2006; US voluntary approach from 2017; global WHO action plan). Companies that have already invested in transition are ahead; those that have not face increasing compliance risk and market access restrictions.
$793M in proposals received (417 submissions); awards expected by fall 2025; covers prevention, vaccines, therapeutics
DOJ Antitrust Investigation – Egg Producers
Launched April 2025; examining price-fixing allegations amid 247% profit increase by largest producer
Meat & Poultry Special Investigator Act (S.1312)
Proposed creation of Office of Special Investigator for Competition Matters within USDA – pending
Food Security & Farm Protection Act (S.1326)
Would prohibit states from imposing certain standards on preharvest agricultural production sold in interstate commerce – relevant to cage-free mandates
CHAPTER 6: FEED ADDITIVE & NUTRITION STRATEGIES
PRECISION NUTRITION SIGNAL: The industry’s shift to reduced crude protein (CP) diets, precisely supplemented with industrial amino acids (L-Lys, DL-Met, L-Thr, L-Trp, L-Val) remained the dominant reformulation strategy in 2025. Lower CP diets reduce feed cost, lower N excretion (environmental benefit), and reduce substrate for pathogenic bacteria. With amino acid prices remaining favorable, there are few economic arguments for maintaining high CP diets.
6.1 The Post-AGP Transition: Where the Industry Stands
The antibiotic-free (ABF) production movement accelerated further in 2025. With the EU ban on AGPs in place since 2006 and the US moving toward voluntary phase-out, the entire industry is in active transition. The key challenge: AGP removal creates enteric health gaps that must be addressed with alternative tools. Without effective management, removal of AGPs leads to increased necrotic enteritis, Campylobacter colonization, and poorer FCR.
6.2 Heat Stress – A Growing Production Challenge
Climate-related heat stress was a highlighted research and production topic in 2025. Modern high-performance broiler genetics have been selectively bred for rapid growth under thermoneutral conditions. Heat stress impairs feed intake, FCR, immunity, meat quality, and reproduction. Management strategies:
Vitamin C and E supplementation at heat stress periods
Betaine inclusion as an osmolyte; reduces supplemental methionine requirement under heat stress
Feed schedule adjustment (limit feeding during hottest hours; early morning/evening feeding)
Housing design investment: tunnel ventilation, evaporative cooling, adequate air velocity
6.3 In Ovo Technology
In ovo vaccination and nutrition delivery continued to advance in 2025. Key developments include high-throughput systems (3,000 eggs/hour at 99% accuracy) for in ovo vaccination and nutritional interventions. Early-life gut programming through in ovo delivery of probiotics, nutrients, and vaccine antigens is becoming an increasingly important hatchery-level biosecurity and performance tool.
CHAPTER 7: MARKET TRENDS & CONSUMER SHIFTS
7.1 Poultry Gaining Share vs. Other Proteins
Elevated beef prices throughout 2025 – driven by tight US cattle supply (herd at decades-long lows) and high demand – continued to push consumers toward poultry as a cost-effective protein. This dynamic is a structural tailwind for the broiler industry globally.
Market Dynamic
Detail
US broiler net cash farm income 2025
+27% YoY – livestock sector outperforms crop side
Global poultry market value (2025)
$316.77 billion; projected $433.98B by 2034 (CAGR 3.56%)
Global poultry export growth 2025
+1.8% to 16.9 million MT
Supermarkets poultry market share
42.1% of poultry distribution (2024)
Online poultry retail growth rate
CAGR 11.4% (fastest growing channel)
Italy – poultry share of total meat consumed
>44% in 2025
FAO Meat Price Index – poultry
Decreased in 2025 from mid-2024 high (broiler ample supply)
7.2 Cage-Free & Animal Welfare Commitments
The cage-free transition is structurally undersupplied in the US. Corporate commitments made in 2014–2017 implied a need for 220 million cage-free layers by 2025–26. Current production is well below that target. This creates both a market opportunity (premium pricing) and a risk (HPAI vulnerability concerns in cage-free systems). Producers must balance welfare compliance with biosecurity protocols.
7.3 Antibiotic-Free, Organic, and Specialty Products
Consumer and corporate buyer demand for ABF, No Antibiotics Ever (NAE), organic, and pasture-raised products continued to grow in premium markets in 2025. The pasture-raised egg segment reported 30% annual growth rates despite high price points. For integrated producers, this requires dedicated production lines with separate management protocols, supply chain segregation, and robust documentation systems.
7.4 Sustainability Pressure
Feed manufacturers and integrators are under growing pressure from retail and foodservice customers, NGOs, and regulators to demonstrate reduced environmental footprint. Key metrics under scrutiny:
GHG emissions per kg of chicken meat produced (Scope 1, 2, and 3)
Deforestation-free supply chains for soy (EU Deforestation Regulation – EUDR)
Feed conversion ratio improvement as a sustainability lever
EUDR NOTE: The EU Deforestation Regulation requires companies to ensure that soy used in feed does not originate from recently deforested land. Implementation deadlines have been debated, but traceability requirements for soy origin – particularly from Brazil – are operationally significant for EU feed manufacturers and importers.
CHAPTER 8: STRATEGIC LESSONS & ACTION PRIORITIES
8.1 Summary: Top 10 Lessons of 2025
#
Lesson
Key Data Point
1
HPAI is now a permanent structural risk, not a cyclical one. Biosecurity investment must be treated as core capital expenditure.
CDC: H5N1 now enzootic in North American wild birds; US flock 8% below 2022 baseline
2
Egg production is structurally more vulnerable than broiler production – different biosecurity and business continuity protocols are required.
75% of HPAI losses = layers; broilers grew 1.4% in 2025
3
Vaccination for HPAI is the central unresolved debate of the decade – expect DIVA strategies to become standard within 3–5 years as industry and regulators align.
417 vaccine/research proposals submitted to USDA Grand Challenge
4
Trade concentration is a strategic vulnerability. Diversify export markets actively; do not allow 70%+ of any product to go to one trading bloc.
China + Mexico + Canada = 70% of US corn exports; 60% of soy; 45% of poultry
5
Grain prices are favorable NOW – lock in contracts and assess forward pricing opportunities while corn and SBM are at multi-year lows.
Corn -3.9% in 2025; SBM -4.3%; both 3rd consecutive annual decline
6
AMR regulations are accelerating everywhere. Transitioning to ABF production is no longer a ‘maybe’ but a ‘when’ – plan now.
EU: AMR in poultry ‘persistently high’ per EFSA/ECDC March 2025 report
7
EFSA’s 2025 WGS guidance fundamentally changes the cost and timeline of getting microbial feed additives authorized in the EU.
WGS now mandatory for all microbial characterizations; legacy dossiers need revision
8
Amino acids and precision nutrition remain the most cost-effective tool for diet optimization: lower CP, better FCR, lower N excretion, reduced enteric pathogen substrate.
Amino acids = 33.6% of global feed additive market by value
9
Brazil’s HPAI outbreak demonstrated both the vulnerability of global trade and the effectiveness of regionalized response protocols.
Brazil exports fell 12.9% in May but year-end positive; China temporarily banned; UAE stepped up
10
Climate/heat stress is an underappreciated production risk that compounds disease susceptibility and reduces performance in high-performing genetics.
IPCC: global surface temperature +0.9°C since mid-20th century; impacts on poultry FCR, immunity, mortality increasing
8.2 Action Priority Matrix for Management Teams
Priority Area
Immediate Actions (0–6 months)
Medium-Term (6–18 months)
HPAI Biosecurity
Complete USDA-style biosecurity assessments; audit wild bird access; upgrade water and air biosecurity; train all staff
Brazil HPAI market re-entry for China – recovery of the world’s #1 poultry export relationship
US corn/soy 2026 planting intentions (March) – USDA Prospective Plantings report is the key 2026 procurement signal
2025 demonstrated that the feed and animal production industry operates in an environment of simultaneous, compounding risks – biological, geopolitical, regulatory, and climatic. The companies that performed best were those with robust biosecurity infrastructure, agile procurement teams, clear AMR transition roadmaps, and diversified market exposure. There is no single silver bullet. Systematic risk management, not reactive crisis response, is the competitive differentiator going forward.
KEY SOURCES & REFERENCES
This article draws on data and analysis from the following sources:
Organization
Document / Resource Referenced
USDA APHIS / FAS
HPAI flocks data (2025); Livestock & Poultry World Markets (Dec 2025); WASDE reports; Five-Pronged HPAI Strategy
FAO
Food Outlook June 2025; OECD-FAO Agricultural Outlook 2025–2034; FAO Meat Price Index
OECD
OECD-FAO Agricultural Outlook 2025–2034 (July 2025)
WOAH
HPAI Report #68 (Feb 2025); State of World Animal Health 2025; HPAI 10-Year Strategy 2024–2033
EFSA / ECDC
Joint AMR Report (March 2025); 2025 QPS updated list; EFSA 2025 Guidance on Microorganisms (Nov 2025)
PAHO / WHO
Epidemiological Update H5N1 in the Americas (Jan 2025)
Corn & Other Feed Grains Outlook (2025–26 WASDE updates)
Frontiers in Veterinary Science
Phytogenic feed additives – gut health modulation (Aug 2025); Antibiotic alternatives – One Health (Jul 2025)
EW Nutrition and GRASP Strengthen Strategic Partnership
Visbek and Curitiba, 3rd February 2026 – EW Nutrition and GRASP are pleased to announce a significant strengthening of their collaboration through a new agreement that will see EW Nutrition increase its ownership stake in GRASP from its current position to full ownership over the next four years.
This strategic move reflects both companies’ commitment to long-term growth and their shared vision for expanding EW Nutrition’s market-leading position in the industry. The phased transition will ensure business continuity while supporting GRASP’s ongoing operations and development initiatives in Brazil.
“This agreement represents a natural evolution of our successful partnership,” said Jan Vanbrabant, CEO of EW Nutrition. “We are excited to deepen our investment in GRASP and its exceptional team, products, and operations in Brazil.”
GRASP’s portfolio includes world-leading products for toxin mitigation (Mastersorb), gut health management (Activo) and other industry-recognized solutions. The company’s dedicated team will remain focused on delivering the quality and innovation that have established GRASP as a trusted name in the market.
“We look forward to this next chapter in our partnership with EW Nutrition,” said Alysson Hoffmann Pegoraro, GRASP Managing Director. “I am confident that this agreement will help to not only continue producing and delivering innovative solutions for our customers worldwide but further increase significantly the global footprint of GRASP.”
The gradual transition to full ownership will be completed by the end of 2029, ensuring a smooth integration process that preserves GRASP’s operational strengths and further solidifies EW Nutrition’s market position.
About EW Nutrition
EW Nutrition is an animal nutrition company that offers integrators, feed producers, and self-mixing farmers comprehensive animal nutrition solutions for gut health management, feed quality, digestibility, and more. With production facilities, offices, and development centers on 6 continents, EW Nutrition researches, manufactures, markets, and services its products and programs to support customers wherever they are.
About GRASP
GRASP was founded in 2001 to provide the animal nutrition and health market with cutting-edge technological, natural, and functional products. Investment in industrial processes, manufacturing expansion, obtaining international certification (GMP+) and development and production units in Curitiba and in São Paulo ensure seamless quality and service for customers in around the world. Since 2011, it has been majority owned by EW Nutrition.
Media Contact
marketing@ew-nutrition.com
Learning from AGP mechanisms to advance poultry nutrition
By Ilinca Anghelescu, Dr. Andreas Michels, Predrag Persak
Our understanding of how nutrition influences growth and resilience in poultry has greatly expanded in recent years. It is now clear that animal performance stems to a large extent from a balance between metabolism, immune function, and the gut microbiome. These systems interact continuously, and even small nutritional or environmental changes can shift the animals’ physiological response. This growing knowledge has encouraged the development of nutritional strategies and feed components that work through adaptive, non-antibiotic mechanisms. One recent proposed explanation for these responses has rapidly gained ground: hormetic modeling.
Hormetic modeling describes how small or moderate doses of nutritional components can activate beneficial adaptive responses (improved resilience or metabolic efficiency), while excessive doses become harmful. This idea parallels, largely speaking, Paracelsus’s famous principle: “The dose makes the poison.” In poultry nutrition, such hormetic patterns are well recognized in nutrients like trace elements (selenium, zinc) and specific amino acids (for example, arginine). At optimal levels, these nutrients support antioxidant defense, growth, and immune balance, whereas excessive intake may cause oxidative or metabolic stress
This review examines the hormetic principle and its application to modern poultry/swine feeding concepts, exploring how balanced nutrient design and controlled inclusion of bioactive compounds can strengthen cellular adaptation, improve stress tolerance, and enhance production efficiency.
How do AGPs actually work?
Despite AGP’s widespread historical use, the precise mechanisms by which subtherapeutic doses of antibiotics enhance animal productivity remained poorly understood. Recent advances in systems biology and mitochondrial research propose new answers, much needed to develop future advanced nutritional systems.
The traditional explanations for AGP efficacy have focused primarily on antimicrobial effects:
reducing nutrient competition from microorganisms
decreasing harmful bacterial metabolites
improving gut wall morphology (thinner gut wall ➡ better nutrient absorption)
preventing subclinical infections
However, these mechanisms alone could not fully explain why different classes of antibiotics with diverse mechanisms of action produce similar growth-promoting effects (Gutierrez-Chavez et al., 2025).
Niewold (2007) hypothesized that the primary mechanism of AGPs is non-antibiotic anti-inflammatory activity, reducing the energetic costs of chronic low-grade inflammation. Inflammation diverts nutrients from growth toward immune responses, with cytokine production (particularly IL-1β, IL-6, and TNF-α) suppressing anabolic pathways (Kogut et al., 2018). AGPs appear to selectively inhibit pro-inflammatory cytokine production without completely suppressing immune function.
A paper published in 2024 by Fernandez Miyakawa et al. proposes that antibiotics at subtherapeutic levels act primarily through mitochondrial hormesis and adaptive stress responses, and not simply through antimicrobial activity. In this model, mitochondria act as bioenergetic hubs and signaling centers. Low-dose antibiotics trigger mild mitochondrial stress, which triggers the activation of adaptive protective pathways.This in turn induces mitokine release, leading to systemic adaptive responses improving growth, feed efficiency, and disease tolerance.
Mechanism of action in the hormetic model of AGP efficiency
Hormesis is a biphasic mechanism whereby high doses are toxic, but low doses stimulate adaptive responses and are beneficial. In the case of AGPs, Fernandez Miyakawa et al. propose that low doses stimulate growth, stress resistance, and cellular repair.
Key signaling pathways
As Bottje et al. (2006, 2009) shows, efficient animals often have mitochondrial inner membranes that are less permeable to protons and other ions, allowing for more effective coupling between electron transport and ATP synthesis, which reduces energy loss through proton leak and maximizes the production of ATP per oxygen molecule consumed. Lower membrane permeability is influenced by factors like decreased membrane surface area per protein mass, specific membrane protein content (such as adenine nucleotide translocase), and fatty acid composition in the membrane phospholipids, all contributing to a tighter barrier that prevents unregulated electron or proton flow and supports higher energetic efficiency. Such features make mitochondria in efficient species more capable of maintaining membrane integrity and ATP generation, especially when facing environmental stress, as seen in freeze-tolerant animals whose mitochondria do not undergo damaging permeability transitions under extreme conditions.
Nrf2
Many AGPs interfere with mitochondrial protein synthesis and electron transport chain. At subtherapeutic levels, they cause a mild ROS increase, which triggers the activation of redox-sensitive transcription factor Nrf2. Since Nrf2 regulates over 250 antioxidant, detoxification, and anti-inflammatory genes, the result is improved cell survival, redox balance, and tolerance to stress.
Figure 1 From Zhang et al., 2024
Mitokine production
Mitokines are “signaling molecules that enable communication of local mitochondrial stress to other mitochondria in distant cells and tissues” (Burtscher 2023). Through fibroblast growth factor 21 (FGF21), growth differentiation factor 15 (GDF15), adrenomedullin2 (ADM2) etc, these stress signals are released systemically and coordinate tissue-wide responses, leading to improved growth and resilience.
Inflammation and disease defense
While the negative side of antibiotic growth promoters is well researched and understood (Rahman et al., 2022), science can advance by isolating the positive effects and attempting to offer different pathways to the same benefits. One such lesson can be derived from understanding inflammation pathways and responses.
Chronic low-grade intestinal inflammation is common in modern poultry production, due to diet, microbiota shifts, high metabolic demands etc. This inflammation diverts energy from growth to immune responses.
AGPs reduce the energy costs of this inflammation in three main ways:
Reduces inflammation through adaptive stress response
Raising the threshold to trigger inflammation
Promoting overall resilience, rather than simply killing pathogens
Fernandez Miyakawa et al. suggest, in this emerging model, that disease defense can operate two different actions: resistance to health challenges through reduction of the pathogen load (which is driven by the immune system and is energy costly); and overall resilience by reducing host damage without reducing the pathogen load. AGPs, the authors claim, mainly promote resilience by enhancing mitochondrial stress responses and tissue repair, i.e. more precisely:
Direct mitochondrial stimulation in intestinal epithelial cells
Metabolic optimization supporting growth and feed efficiency
Figure 2 From Fernandez Miyakawa et al., 2024.
In this context, “metabolic optimization” refers to the enhancement of metabolic processes within livestock or poultry to support efficient growth, feed conversion, and physiological resilience, without relying on immune-mediated pathways that are energetically costly. Scientific evidence shows that metabolic optimization involves improving nutrient assimilation, promoting more efficient energy production in tissues (such as mitochondrial ATP synthesis), and minimizing wasteful metabolic byproducts, resulting in reduced feed intake per unit of growth and better utilization of dietary nutrients (Rauw 2025, El-Hack 2025).
Function of feed additives and feed components
Feed additives and feed components in many ways represent the complete other side of the spectrum from antibiotics, but are there some features where antibiotics and feed additives come close in their functions? There is a good case to be made for certain feed additives ultimately working in the animal to achieve similar benefits to the desirable, non-medicinal usage of AGP´s. Especially with the emergent model of AGP mechanism described above, it is worth discussing how certain feed additives can support the same end goal: promoting animal resilience.
Lillejhoj et al (2018), Gutierrez-Chavez et al. (2025) and others outline the end-results such products must achieve:
Growth performance & feed conversion efficiency
Promotion of animal productivity under real-world conditions
Support gut homeostasis
Non-adverse effect on the immune system
Reduction of oxidative stress
Support organism in mitigation of enteric inflammatory consequences
Within the hormetic model, possibly the most important systemic benefit is, in one phrase, promoting resilience. Phytomolecules have long been used, in human and animal medicine, for the same end goal. The mechanisms described below should naturally be seen with caution, as phytomolecule microbiome effects can be subtler and context-dependent. However, the substantiating literature has been increasingly accumulating on these specific topics.
1. Immunometabolic regulation
Phytomolecules demonstrate remarkably similar anti-inflammatory effects to what Niewold (2007) suggested was a primary mechanism of AGPs: non-antibiotic anti-inflammatory activity, reducing the energetic costs of chronic low-grade inflammation. Inflammation diverts nutrients from growth toward immune responses, with cytokine production (particularly IL-1β, IL-6, and TNF-α) suppressing anabolic pathways (Kogut et al., 2018). AGPs appear to selectively inhibit pro-inflammatory cytokine production without completely suppressing immune function. A similar effect can be observed with various types of phytomolecules, which significantly reduced pro-inflammatory and/or increased anti-inflammatory cytokine expression in animals challenged with several pathogens. The anti-inflammatory mechanism appears to involve inhibition of NF-κB activation and modulation of MAPK signaling pathways (Kim et al., 2010; Long et al., 2021).
2. Mitochondrial hormesis and energy metabolism
Fernández Miyakawa et al. (2024, see above) proposed that AGPs exert growth-promoting effects through mitochondrial hormesis – subtherapeutic antibiotic doses induce mild mitochondrial stress, triggering adaptive responses that enhance mitochondrial function, energy metabolism, and cellular resilience. This mechanism, while requiring further validation, explains why different antibiotics with diverse targets produce similar growth outcomes.
The mitochondrial stress response involves activation of the IL-6 receptor family signaling cascade, which regulates metabolism, growth, regeneration, and homeostasis in liver and other tissues (Perry et al., 2024). Subtherapeutic antibiotic exposure activates proteins involved in growth and proliferation through IL-6R gp130 subunit signaling, including JAK, STAT, mTOR, and MAPK pathways.
Phytomolecules demonstrate similar mitochondrial effects. Perry et al. (2024) showed that increased activity of AMPK, mTOR, PGC-1α, PTEN, HIF, and S6K can also be available via phytomolecule activity, suggesting enhanced anabolic metabolism.
Capsicum oleoresin supplementation in broilers increased jejunal lipase and trypsin activity, enhanced ileal amylase activity, improved jejunal morphology, and modulated immune organ development, indicating enhanced digestive efficiency and nutrient utilization (Li et al., 2022).
Compounds such as vanillin, thymol, eugenol have been shown to improve glucose and lipid metabolism through TRPV1 activation and mitochondrial function enhancement (Gupta et al., 2022; Zhang et al., 2017).
3. Gut microbiota modulation
AGPs selectively reduce specific microbial populations, particularly Lactobacillus species that produce bile salt hydrolase (BSH). Since BSH reduces fat digestibility and thus weight gain, AGP-mediated reduction of BSH-producing bacteria enhances energy extraction and growth (Lin, 2014; Bourgin et al., 2021).
Recent research by Zhan et al. (2025) using single-molecule real-time 16S rRNA sequencing demonstrated that therapeutic antibiotic doses (lincomycin, gentamicin, florfenicol, benzylpenicillin, ceftiofur, enrofloxacin) significantly altered chicken gut microbiota composition, with Pseudomonadota and Bacillota becoming dominant phyla after exposure. Different antibiotics produced distinct temporal effects on microbial diversity and community structure.
Phytomolecules exert targeted antimicrobial effects while promoting beneficial bacteria. Dietary supplementation with 800 mg/kg Capsicum extract in Japanese quails reduced cecal counts of pathogenic bacteria (Salmonella spp., E. coli, coliforms) while modulating Lactobacilli populations (Reda et al., 2020).
In pigs, 80 mg/kg natural capsicum extract increased cecal propionic acid and total volatile fatty acid concentrations, with increased butyric acid in the colon – indicating enhanced fermentation by beneficial bacteria (Long et al., 2021).
Capsicum and Curcuma oleoresins altered intestinal microbiota composition in commercial broilers challenged with necrotic enteritis, reducing disease severity through microbiome modulation (Kim et al., 2015).
Capsaicin demonstrates selective antimicrobial activity, inhibiting pathogenic Gram-negative bacteria while favoring development of certain Gram-positive bacteria. The antibacterial mechanism involves induction of osmotic stress and membrane structure damage (Adaszek et al., 2019; Rosca et al., 2020).
4. Intestinal barrier function and gut health
AGPs have been associated with improved intestinal morphology, including increased villus height and reduced crypt depth, which enhance absorptive capacity (Gaskins et al., 2002).
Phytomolecules produce similar or superior effects. Capsicum extract (80 mg/kg) in pigs increased ileal villus height and upregulated MUC-2 gene expression, indicating enhanced gut barrier function and integrity. The improved barrier function correlated with reduced diarrhea incidence (Liu et al., 2013; Long et al., 2021).
Allium hookeri extract increased expression of tight junction proteins (claudins, occludins, ZO-1) in LPS-challenged broiler chickens, demonstrating direct enhancement of barrier integrity (Lee et al., 2017).
5. Oxidative stress mitigation
Oxidative stress impairs growth by damaging cellular components and triggering inflammatory responses. AGPs reduce oxidative stress indirectly through anti-inflammatory effects and microbiota modulation (Bortoluzzi et al., 2021).
Phytomolecules possess direct antioxidant properties. Capsicum extract (50 mg/kg) in heat-stressed quails reduced serum and ovarian malondialdehyde (MDA) while increasing superoxide dismutase (SOD) and catalase (CAT) activities. Ovarian transcription factors showed decreased NF-κB and increased Nrf2 and HO-1 expression (Sahin et al., 2016).
A mixture of herbal extracts including pepper reduced thiobarbituric acid reactive substances and MDA in broiler liver and muscle, while increasing glutathione peroxidase (GSH-Px) activity and improving antioxidant enzyme expression (Saleh et al., 2018).
Capsicum extract (80 mg/kg) in pigs increased total antioxidant capacity, SOD, and CAT while reducing MDA levels, demonstrating robust antioxidant effects (Long et al., 2021).
Standardization and controlled release: Critical success factors
A major criticism of phytomolecules has been inconsistent efficacy across studies. However, this variability largely reflects differences in:
Active compound concentrations
Bioavailability and stability
Dosing precision
Product quality and standardization
Microencapsulation is one of the technologies that address the standardization and bioavailability challenges. It protects volatile compounds from degradation during feed processing and storage, with encapsulated essential oils showing significantly higher retention compared to unprotected forms (Stevanović et al., 2018). By creating a protective barrier around active ingredients, microencapsulation enables controlled release in specific regions of the gastrointestinal tract, improving absorption efficiency and reducing dose variability (Bringas-Lantigua et al., 2011). The technology also masks unpalatable flavors that can reduce feed intake while standardizing active ingredient concentrations through precise manufacturing processes (Gharsallaoui et al., 2007). Studies demonstrate that spray-dried microencapsulated essential oils achieve encapsulation efficiencies exceeding 93% with minimal loss during storage (Hu et al., 2020), and can be engineered for enzyme-mediated release to ensure bioactive delivery at optimal intestinal sites (Elolimy et al., 2025).
Mechanistic synthesis: An integrated model
The evidence indicates that both AGPs and phytomolecules operate through an integrated network of effects:
Primary Level: Selective antimicrobial effects modify gut microbiota composition
This integrative model explains why multiple antibiotics with different mechanisms produce similar growth outcomes: they converge on common pathways regulating immunometabolism and mitochondrial function (Fernández Miyakawa et al., 2024).
Phytomolecules operate through the same mechanistic framework but with potential advantages:
Safety and antimicrobial resistance considerations
Antibiotic exposure significantly disrupts gut microbiota diversity and stability, with effects persisting beyond withdrawal periods. The study by Zhan et al. (2025) demonstrated that different antibiotics produce varying degrees of microbiota disruption, with florfenicol and gentamicin showing the strongest and most persistent effects.
In contrast, phytomolecules generally do not generate resistance through the same mechanisms as antibiotics. Some phytochemicals may actually enhance antibiotic efficacy and resensitize resistant bacteria through structural modifications of bacterial membranes (Khameneh et al., 2021; Suganya et al., 2022).
However, one study reported increased correlation between antibiotic resistance genes (ARGs) and mobile genetic elements in pig feces after mushroom powder supplementation, suggesting that certain phytogenic compounds may increase ARG mobility (Muurinen et al., 2021). This emphasizes the need for continued surveillance of phytomolecule effects on resistance gene dynamics.
Capsaicinoids and capsinoids have well-established safety profiles. Capsiate, a non-pungent analogue of capsaicin, exhibits substantially lower toxicity while maintaining similar metabolic and growth-promoting effects (Gupta et al., 2022). No adverse effects on animal health or product quality have been reported at recommended dosages in reviewed studies.
Future directions and research needs
Despite substantial progress, several areas require further investigation:
Mechanistic refinement: Detailed characterization of signaling pathways, particularly the IL-6R/gp130 cascade and mitochondrial stress responses
Precision formulation: Development of combinations optimized for specific production stages, environmental conditions, and disease pressures
Bioavailability optimization: Advanced delivery systems ensuring consistent active compound release and absorption
Microbiome-host interaction mapping: High-resolution characterization of microbial community shifts and their functional consequences
Economic validation: Large-scale production trials assessing cost-effectiveness compared to AGPs and disease management costs
Conclusions
The scientific evidence demonstrates that standardized phytomolecules operate through well-characterized biological mechanisms that substantially replicate those of AGPs:
Anti-inflammatory effects reducing energetic costs of immune activation
Mitochondrial hormesis enhancing energy metabolism and cellular resilience
Selective microbiota modulation supporting beneficial bacteria while controlling pathogens
Intestinal barrier enhancement improving nutrient absorption and reducing translocation
Antioxidant activity mitigating oxidative stress and supporting immune function
When properly standardized and formulated for controlled release, phytomolecules deliver growth promotion, feed efficiency improvements, and disease resistance comparable to AGPs, while potentially offering advantages in AMR risk profile, stress resilience, and consumer acceptance.
The mechanistic convergence between AGPs and phytomolecules, coupled with demonstrated efficacy in controlled trials, provides producers with confidence that science-based phytomolecular interventions represent legitimate alternatives to AGPs. Success depends on product standardization, appropriate dosing, and understanding that phytomolecules work through fundamental biological pathways rather than undefined or mystical mechanisms.
As the livestock industry continues to navigate the post-AGP era, standardized phytomolecules offer a scientifically sound, mechanistically validated approach to maintaining animal performance, health, and welfare while addressing antimicrobial resistance concerns.
References
Adaszek, Ł., et al. “Properties of Capsaicin and Its Utility in Veterinary and Human Medicine.” Research in Veterinary Science, vol. 123, 2019, pp. 14 – 19.
Bottje, W., et al. “Mitochondrial proton leak kinetics and relationship with feed efficiency within a single genetic line of male broilers”. Poultry Science, Volume 88, Issue 8, 1 August 2009, p. 1683-1693.
Bortoluzzi, C., et al. “A Protected Complex of Biofactors and Antioxidants Improved Growth Performance and Modulated the Immunometabolic Phenotype of Broiler Chickens Undergoing Early Life Stress.” Poultry Science, vol. 100, 2021, p. 101176.
Bourgin, M., et al. “Bile Salt Hydrolases: At the Crossroads of Microbiota and Human Health.” Microorganisms, vol. 9, no. 1122, 2021.
Bravo, D., et al. “A Mixture of Carvacrol, Cinnamaldehyde, and Capsicum Oleoresin Improves Energy Utilization and Growth Performance of Broiler Chickens Fed Maize-Based Diet.” Journal of Animal Science, vol. 92, 2014, pp. 1531 – 1536.
Bringas-Lantigua, M., et al. “Influence of Spray-Dryer Air Temperatures on Encapsulated Mandarin Oil.” Drying Technology, vol. 29, 2011, pp. 520–526.
Burtscher, J., et al. “Mitochondrial Stress and Mitokines in Aging.” Aging Cell, vol. 22, no. 2, 2023, e13770.
El-Hack, M. et al. “Integrating metabolomics for precision nutrition in poultry: optimizing growth, feed efficiency, and health”. Frontiers in Veterinary Science, Sec. Animal Nutrition and Metabolism, Volume 12 – 2025. https://doi.org/10.3389/fvets.2025.1594749
Elolimy, Ahmed A., et al. “Effects of Microencapsulated Essential Oils and Seaweed Meal on Growth Performance, Digestive Enzymes, Intestinal Morphology, Liver Functions, and Plasma Biomarkers in Broiler Chickens.” Journal of Animal Science, vol. 103, 2025, p. skaf092, https://doi.org/10.1093/jas/skaf092.
Fernández Miyakawa, Mariano E., et al. “How Did Antibiotic Growth Promoters Increase Growth and Feed Efficiency in Poultry?” Poultry Science, vol. 103, no. 2, 2024, article 103136. https://doi.org/10.1016/j.psj.2023.103136
Gaskins, H. Rex, C. T. Collier, and D. B. Anderson. “Antibiotics as Growth Promotants: Mode of Action.” Animal Biotechnology, vol. 13, no. 1, 2002, pp. 29 – 42.
Gharsallaoui, A., et al. “Applications of Spray-Drying in Microencapsulation of Food Ingredients: An Overview.” Food Research International, vol. 40, no. 9, 2007, pp. 1107-21.
Gutiérrez-Chávez, Vanesa, et al. “Capsaicinoids and Capsinoids of Chilli Pepper as Feed Additives in Livestock Production: Current and Future Trends.” Animal Nutrition, vol. 22, 2025, pp. 483 – 501. https://doi.org/10.1016/j.aninu.2025.03.014.
Gupta, A., et al. “Capsaicin and Capsinoids: Recent Updates on Their Health Benefits and Mechanisms of Action.” Phytotherapy Research, vol. 36, no. 5, 2022, pp. 1898 – 1912.
Hu, Q., Li, X., Chen, F., Wan, R., Yu, C.-W., Li, J., McClements, D. J., & Deng, Z. (2020). “Microencapsulation of an essential oil (cinnamon oil) by spray drying: Effects of wall materials and storage conditions on microcapsule properties“. Journal of Food Processing and Preservation, 44(11). https://doi.org/10.1111/jfpp.14805
Khameneh, B., et al. “Mechanisms of Antibiotic Resistance Resensitization by Phytochemicals: Review.” Phytomedicine, vol. 85, 2021, p. 153529.
Kim, D. K., et al. “Effects of Capsicum and Curcuma on Necrotic Enteritis in Broilers.” Poultry Science, vol. 94, 2015, pp. 2314 – 2321.
Kim, J. S., et al. “Anti-inflammatory Effects of Plant-Derived Molecules via NF-κB and MAPK Pathways.” International Immunopharmacology, vol. 10, no. 3, 2010, pp. 306 – 314.
Lee, S. H., et al. “Allium Hookeri Extract Enhances Tight Junction Proteins in Broilers.” Journal of Animal Physiology and Animal Nutrition, vol. 101, no. 1, 2017, pp. e48 – e56.
Li, X., et al. “Capsicum Oleoresin Supplementation Improves Digestive Enzyme Activity and Gut Morphology in Broilers.” Poultry Science, vol. 101, no. 7, 2022, p. 101844.
Lin, J. “Effect of Antibiotics on the Intestinal Microbiota and Their Role in Animal Growth.” Animal Biotechnology, vol. 25, no. 3, 2014, pp. 149 – 157.
Lillehoj, H., et al. “Phytochemicals as Antibiotic Alternatives to Promote Growth and Enhance Host Health.” Veterinary Research, vol. 49, no. 76, 2018.
Liu, Y., et al. “Dietary Capsicum Extract Enhances Intestinal Barrier Function and Growth in Pigs.” Journal of Animal Science, vol. 91, 2013, pp. 518 – 525.
Long, L., et al. “Phytogenic Feed Additives Modulate Intestinal Immunity and Antioxidant Status in Pigs and Poultry.” Frontiers in Veterinary Science, vol. 8, 2021, p. 620998.
Muurinen, J., et al. “Mushroom Powder Supplementation Increases Antibiotic Resistance Gene Mobility in Pig Feces.” Frontiers in Microbiology, vol. 12, 2021, p. 676678.
Niewold, T. A. “The Non-antibiotic Anti-inflammatory Effect of Antimicrobial Growth Promoters, the Real Mode of Action? A Hypothesis.” Poultry Science, vol. 86, 2007, pp. 605 – 609.
Perry, F., C. N. Johnson, L. Lahaye, E. Santin, D. R. Korver, M. H. Kogut, and R. J. Arsenault. “Protected Biofactors and Antioxidants Reduce the Negative Consequences of Virus and Cold Challenge by Modulating Immunometabolism via Changes in the Interleukin-6 Receptor Signaling Cascade in the Liver.” Poultry Science, vol. 103, no. 9, 2024, article 104044. https://doi.org/10.1016/j.psj.2024.104044
Rahman, Md, et al. “Insights in the Development and Uses of Alternatives to Antibiotic Growth Promoters in Poultry and Swine Production.” Antibiotics, vol. 11, no. 6, 2022, p. 766, https://doi.org/10.3390/antibiotics11060766.
Reda, F. M., et al. “Capsicum Extract Supplementation Modulates Gut Microbiota and Performance in Japanese Quails.” Animal Feed Science and Technology, vol. 265, 2020, p. 114507.
Rosca, I., et al. “Capsaicin Induces Osmotic Stress in Gram-negative Pathogens.” Veterinary Sciences, vol. 7, no. 4, 2020, p. 172.
Sahin, K., et al. “Dietary Capsicum Extract Reduces Oxidative Stress in Heat-stressed Japanese Quails.” Poultry Science, vol. 95, no. 2, 2016, pp. 231 – 240.
Saleh, A. A., et al. “Herbal Extract Mixtures Improve Antioxidant Status and Performance in Broilers.” Poultry Science, vol. 97, no. 11, 2018, pp. 3927 – 3936.
Stevanović, Z. D., et al. „Essential oils as feed additives—Future perspectives”. Molecules, 23(7), 2018, pp1717.
Suganya, R., et al. “Phytochemicals in Combination with Antibiotics: Antimicrobial Resistance Breakers.” Antibiotics, vol. 11, 2022, p. 123.
Zhang, Benyuan et al. “Mitochondrial Stress and Mitokines: Therapeutic Perspectives for the Treatment of Metabolic Diseases.” Diabetes & Metabolism Journal vol. 48,1, 2024, pp. 1-18.
Zhan, Ru, et al. “Effects of Antibiotics on Chicken Gut Microbiota: Community Alterations and Pathogen Identification.” Frontiers in Microbiology, vol. 16, 2025, article 1562510. https://doi.org/10.3389/fmicb.2025.1562510
Zhang, Y., et al. “Effects of Vanillin, Thymol, and Eugenol on Glucose and Lipid Metabolism via TRPV1 Activation.” Journal of Agricultural and Food Chemistry, vol. 65, no. 13, 2017, pp. 2719 – 2727.
Europe – Disease Outbreak Report Summary, 6-12 November 2025
Widespread across Europe, indicating active transmission
Data Source: ADIS (Animal Disease Information System) Weekly Notification Created: November 14, 2025
Header image photo credit: Cynthia Goldsmith Content Providers: CDC/ Courtesy of Cynthia Goldsmith; Jacqueline Katz; Sherif R. Zaki
This media comes from the Centers for Disease Control and Prevention’s Public Health Image Library (PHIL), with identification number #1841
EU admits: Regulatory burden is a brake on Europe’s competitiveness. Changes expected for sustainability regulations
by Ilinca Anghelescu, Global Director Marketing and Communications
In a rare move that betrays urgent concerns, the EU is moving to address its economic weaknesses and close competitiveness gaps. Among the targeted changes are burdensome Sustainability regulations.
The release of the European Commission’s “Competitiveness Compass” last week aims to “urgently tackle longstanding barriers and structural weaknesses”, which, the Commission admits, are caused in part by heavy regulatory burdens. One point addressed is “closing the innovation gap”, i.e. investing in AI and digital infrastructure and removing heavy administrative obligations that hinder fast innovation. Another proposal is to diversify dependencies and increase security, in terms of defense and preparedness as well as security in front of climate change threats.
However, of particular importance to agriculture is the list of “horizontal enablers”, i.e. actions to be taken soon that reduce the regulatory burden for farmers and food producers. Policies will thus be recalibrated to balance productivity with environmental goals, particularly under the green and digital transitions. The EU plans to release an “omnibus” package by the end of February, suggesting rolling back or reframing some of the key regulations and policies. Especially under the lens are the Corporate Sustainability Reporting Directive and the Corporate Sustainability Due Diligence Directive. These were about to receive implementation deadlines at the end of 2025 and 2026, compelling companies to take specific steps to curb and/or offset contributions to climate change.
See below the areas highlighted for change in the EC’s Compass.
Streamlining sustainability regulations for agriculture
One major focus is simplifying the regulatory environment to support farmers’ ability to adopt eco-friendly practices without facing administrative overload. Key initiatives include:
Reducing excessive administrative processes linked to sustainability reporting, thereby making it easier for small and medium-sized farmers to participate in carbon reduction or biodiversity schemes.
Encouraging voluntary measures rather than mandatory requirements where possible, ensuring that sustainability practices can be phased in gradually with adequate support.
Scaling back costs through regulatory flexibility
Proportional application of environmental rules: Regulations will be tailored based on farm size and production type, alleviating the burden on small farms and cooperatives. For instance:
Farms participating in carbon farming or agroforestry will benefit from simplified eligibility criteria and streamlined evaluation processes.
Less frequent monitoring and audits are proposed for farms demonstrating long-term sustainability commitments.
Additionally, digital compliance tools will play a role in reducing paperwork. Farmers can use online platforms to track and report environmental performance, cutting costs related to inspections and administrative filings.
Sustainable practices supported by innovation incentives
Rather than relying solely on regulations, the EU plans to incentivize eco-friendly practices through funding mechanisms and access to innovation:
The Common Agricultural Policy (CAP) will expand its financing options for farms transitioning to organic methods, renewable energy usage, or improved nutrient recycling systems.
Green technology access: Subsidized programs will help farmers adopt technologies like precision irrigation and AI-driven crop management, reducing both environmental impact and operational costs.
Integration of environmental goals without compromising competitiveness
The policy framework emphasizes that climate-neutral agriculture must remain productivity-focused. Key mechanisms for achieving this balance include:
Carbon offset programs allowing farmers to generate income by implementing carbon-sequestering practices such as cover cropping and reduced tillage.
Support for sustainable fertilizer alternatives: The EU aims to cut synthetic fertilizer use while promoting domestic production of bio-fertilizers to avoid dependency on imports.
Striking a balance between economics and environmental concerns
By reducing administrative burdens, offering financial incentives, and prioritizing flexibility, the EU attempts to achieve sustainability without hindering productivity. However, according to The Wall Street Journal, some groups – either investors or large companies – have already protested the proposed changes. These are the groups that have made massive internal changes to prepare for the Corporate Sustainability Reporting Directive and the Corporate Sustainability Due Diligence Directive, and who made them an important part of their reporting and positioning.
The omnibus package is due at the end of February, after which it will have to undergo several rounds of reviews and approvals before becoming effective in any way. It remains to be seen if the heavy administrative apparatus of the Commission is able to put these changes in motion with the same urgency that the Compass indicates.
EU Agricultural Outlook 2024-2035: Projected Trends and Challenges
by Ilinca Anghelescu, Global Director Marketing & Communications, EW Nutrition
The European Union (EU) agricultural sector is confronted with challenges and uncertainties stemming from the geopolitical risks, extreme weather events, and evolving market demand. The EU Agricultural Outlook 2024-2035, published last month, highlights the anticipated trends, challenges, and opportunities facing the sector over the medium term, given several considerations likely shaping the future.
Initial considerations for EU agricultural trends
Macroeconomic context
The EU’s real GDP growth is expected to stabilize, contributing to a stable economic environment for agriculture. Inflation rates are projected to return to the European Central Bank’s target of 2% by 2025. Exchange rates will see the Euro slightly appreciating against the US dollar, and Brent crude oil prices are anticipated to stabilize in real terms at approximately $102 per barrel by 2035.
However, despite optimistic declarations in the recent past, we have not solved world hunger. Population growth in lower-income parts of the world is leading to an unequal distribution and, after an initial dip, the number of people going to bed hungry is expected to rise again. Moreover, in the next ten years some improvements are foreseen but no massive changes are expected in the percentage of food groups and calories available per capita.
Climate change impact
Climate change is reshaping EU agriculture by affecting critical natural resources such as water and soil. Agroclimatic zones are shifting northwards, with implications for crop cultivation patterns. For example, regions traditionally suitable for wheat may increasingly shift focus to other crops better adapted to new climate conditions.
Consumer demand
Consumer awareness of sustainability is driving significant shifts in dietary preferences in the EU. The demand for plant proteins like pulses is increasing, while meat consumption, particularly beef and pork, is declining due to environmental and health concerns. Conversely, demand for fortified and functional dairy products is on the rise.
What are the projected agricultural trends in 2024-2035?
Arable crops
Land use: While the total agricultural land in the EU remains stable, a shift in crop focus is anticipated. Land allocated for cereals and rapeseed is expected to decline, making way for soya beans and pulses due to reduced feed demand and policy incentives for plant proteins.
Cereals: Production of cereals, including wheat, maize, and barley, is forecast to stabilize with minor yield increases due to advancements in precision farming and digitalization. Wheat production is set to recover after an expected dip in 2024.
Dairy Sector
Milk production: Although milk yields are projected to increase due to improved genetics and farming practices, the decline in the dairy cow herd will result in a slight overall reduction in milk production by 2035.
Dairy products: The production of cheese and whey will grow steadily, driven by domestic and international demand. Conversely, the consumption of drinking milk is expected to decline, while demand for fortified and functional dairy products grows.
Meat Sector
Beef and veal: Beef production is expected to decrease by 10%, with the EU cow herd shrinking by 3.2 million head by 2035. This decline is attributed to sustainability concerns, high production costs, and changing consumer preferences. Beef consumption is also projected to decline, driven by high prices and a preference for plant-based alternatives.
Pig meat: The sector faces a projected annual production decline of 0.9%, equating to a reduction of nearly 2 million tons compared to 2021-2023 levels. This trend is largely influenced by concerns over sustainability and a declining preference for fatty meats.
Poultry: In contrast, poultry production is forecast to increase due to its healthier image, lower cost, and minimal cultural or religious constraints. However, the growth rate will be slower than in the previous decade.
Upcoming challenges in agriculture
Climate Resilience
The increasing frequency of extreme weather events requires investments in resilient farming practices. Adoption of precision farming and crop diversification is critical to mitigate climate impacts. However, if existing policies are further implemented, greenhouse gas emissions are expected to see a significant decline.
Policy Frameworks
The Common Agricultural Policy (CAP) plays a pivotal role in steering the sector toward sustainability. However, farmers face challenges in adapting to stricter environmental regulations and securing sufficient funding for transitions. The recent Mercosur agreement has already stirred dissent in EU countries that fear unfettered competition without similar policy regulations.
Market Dynamics
Global trade tensions and competition in agricultural markets pose significant risks. While the EU remains a net exporter, dependence on imports for certain crops, such as soya beans, highlights vulnerabilities in supply chains.
In a weather-shock scenario for the EU feed supply chain, the report highlights that increased feed prices would drive up retail meat prices by 10% for poultry and pork producers, and 5% for beef and veal producers. The increase would be less abrupt for retail prices, rising by 3% for pork, and 4% for poultry meat. Producers need to be mindful of the absorbed costs of these potential shocks.
Conclusion
The EU agricultural sector must continue to balance productivity, sustainability, and consumer preferences. While advancements in technology and policy frameworks offer pathways to resilience, addressing challenges such as climate change and market dynamics will be critical to achieving long-term goals.
The ongoing battle with food poisoning: A pressing public health concern
By Dr. Inge Heinzl
Globally, unsafe food leads to 600 million cases of foodborne illnesses each year, resulting in 420,000 deaths, with 40% of these deaths occurring among children under 5 years of age. Especially for immunocompromised elderly and children, the pathogens can be dangerous.
In 2019, 27 European Union (EU) member states reported a total of 5,175 foodborne outbreaks, leading to 49,463 cases of illness, 3,859 hospitalizations, and 60 deaths. This year, e.g., salmonella-contaminated arugula from Italy caused 98 cases in Germany, 16 in Austria, and 23 in Denmark (Whitworth, 2024).
In the United States, the E. coli outbreak recently reported by 13 states and linked to McDonald’s is just one of the foodborne disease incidents this year. Several salmonella infections have also spread nationwide, with pathogens detected in various foods, including eggs, cucumbers, fresh basil, and charcuterie meats (CDC, 2024 LINK).
Symptoms of foodborne diseases may vary
The most common symptoms of food poisoning include stomach pain or cramps together with diarrhea and vomiting, nausea, and probably fever. In severe cases, diarrhea can get bloody and/or last more than 3 days. Fever (temperature over 38°C within the body) can occur, and vomiting can get so severe that the sick person cannot keep liquids inside and suffers from dehydration.
E. coli contamination, particularly from pathogenic strains like E. coli O157:H7, can pose serious health risks to consumers. It has been associated with symptoms ranging from mild gastrointestinal distress to severe conditions like hemolytic uremic syndrome (HUS), which can lead to kidney failure.
Possible sources of contamination
Usually, food is not sterile. It contains beneficial microorganisms such as lactic acid bacteria or cultured molds, but also unwanted ones such as E. coli or salmonella. The crucial point is the proliferation of the harmful ones. Food poisoning is often the result of poor hygiene or wrong processing. Here are some possible causes of getting a foodborne disease.
Undercooked meat products or eggs: Undercooked meat and eggs are primary sources of, e.g., E. coli or salmonella. If these foodstuffs are not cooked to a high enough internal temperature (meat: 70 – 80°C for at least 10 min.), the bacteria can survive and pose risks to consumers. High-speed cooking processes, standard in fast-food restaurants, can lead to unevenly cooked food, increasing the risk of contamination. However, the more probable origins of food poisoning are
Raw vegetables and fresh produce: Leafy greens and other raw vegetables are increasingly associated with E. coli outbreaks. Contamination often occurs during harvesting, processing, or transportation. When vegetables are served raw, such as in salads, the pathogens present might not be eliminated, which can lead to consumer exposure.
Cross-contamination in preparation areas: E. coli can spread easily in food preparation areas if strict separation between raw and cooked foods is not maintained. For example, if raw beef juices come into contact with salad ingredients or utensils, the risk of cross-contamination increases significantly.
Cross-contamination in the slaughterhouse: If infected animals are slaughtered together with healthy animals, the meat of the healthy ones can be contaminated with the juices of the ill ones.
Inadequate supplier protocols and traceability: The complex supply chains used by fast-food companies often involve multiple suppliers across various locations. A lack of strict hygiene and safety practices among suppliers can introduce contaminated food into the restaurant chain’s supply, leading to potential outbreaks.
Countermeasures to protect consumers
To prevent future E. coli outbreaks, implementing a range of countermeasures in food-providing businesses such as restaurants, fast-food chains, and suppliers, focusing on safe food handling, better biosecurity, and improved oversight throughout the supply chain, is vital. Food safety is broader than that, however. It has a critical role in ensuring that food stays safe at every stage of the food chain – from production to harvest, processing, storage, distribution, all the way to preparation and consumption.
Enhanced Cooking Standards and Temperature Monitoring: Ensuring meat is cooked to a safe internal temperature is crucial.
Routine Microbial Testing of High-Risk Foods: Routine microbial testing, particularly of high-risk items like ground beef and fresh produce, can detect E. coli contamination before the food reaches consumers. Testing can be carried out at the supplier level and within restaurants. In cases where contamination is detected, affected products can be removed from circulation promptly, minimizing the risk to customers.
Separation of Raw and Cooked Food Handling Areas: Cross-contamination can be reduced by establishing dedicated areas and utensils for handling raw and cooked foods. For instance, separate workspaces for salad preparation and burger assembly can prevent contact between potentially contaminated raw ingredients and ready-to-eat items. Staff training on the importance of these practices is essential to their successful implementation.
Supplier Standards and Transparent Audits: Supplier chains must ensure that suppliers adhere to strict food safety protocols, including regular sanitation and testing practices. Supplier audits conducted by independent third parties can help verify compliance and identify any gaps in food safety practices. Transparency in these audits can also build consumer trust, as customers are more likely to feel reassured when they know safety checks are in place.
Implementation of High-Pressure Processing (HPP): High-pressure processing (HPP) effectively reduces bacterial contamination in foods without using heat, which can be particularly beneficial for items like fresh produce that are often served raw. HPP uses high levels of pressure to kill pathogens, including E. coli. However, as HPP provokes changes in the structure of vegetable cell walls, it is unsuitable for salads and other leafy greens.
Enhanced Employee Training on Hygiene Practices: Proper hygiene practices are fundamental in preventing contamination. Employees must wash their hands frequently, especially after handling raw foods. Fast-food chains should provide thorough training on proper food safety protocols, including how to handle food items safely and maintain a clean working environment.
Crisis Response Protocols and Traceability Systems: In the event of an outbreak, rapid response is critical. Fast-food companies should have crisis protocols in place that include steps for immediate product recalls, customer notifications, and investigation procedures. Improved traceability systems can also allow companies to track the source of contamination quickly, limiting the spread and reducing the impact on consumers.
Preventing infections with harmful enteropathogens already in the animal: To get “clean” animals arriving at the slaughterhouse, already the farmer must aspire to prevent/treat infections of the animals with pathogens possibly provoking foodborne diseases. For this purpose, the farmer can resort to vaccines and feed supplements supporting gut health, both for prevention and on medicine such as antibiotics when treatment is needed.
A path forward: Strengthening food safety standards
This new E. coli outbreak in the fast-food industry highlights the ongoing challenges of maintaining food safety standards at all food preparation and distribution stages. By implementing stricter cooking standards, enhancing biosecurity measures, enforcing supplier compliance, and improving traceability, fast-food chains like McDonald’s can significantly reduce the risk of E. coli contamination. Ultimately, consumer protection depends on a multifaceted approach that integrates strong hygiene practices, supplier oversight, and advanced technology in food safety. Through these measures, companies can work to restore consumer confidence, minimize health risks, and set a standard for food safety across the industry.


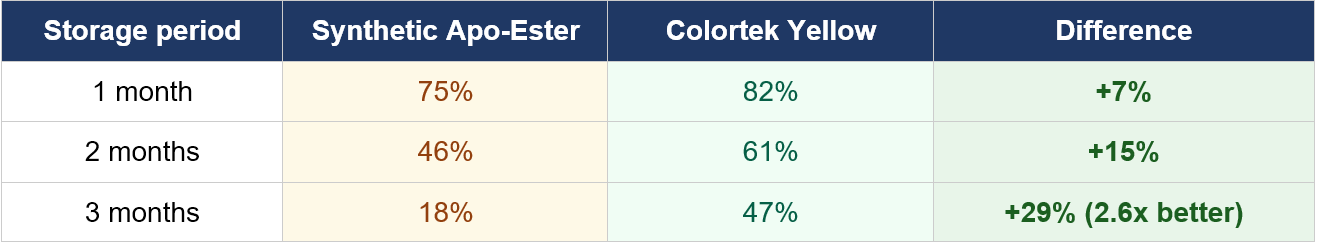


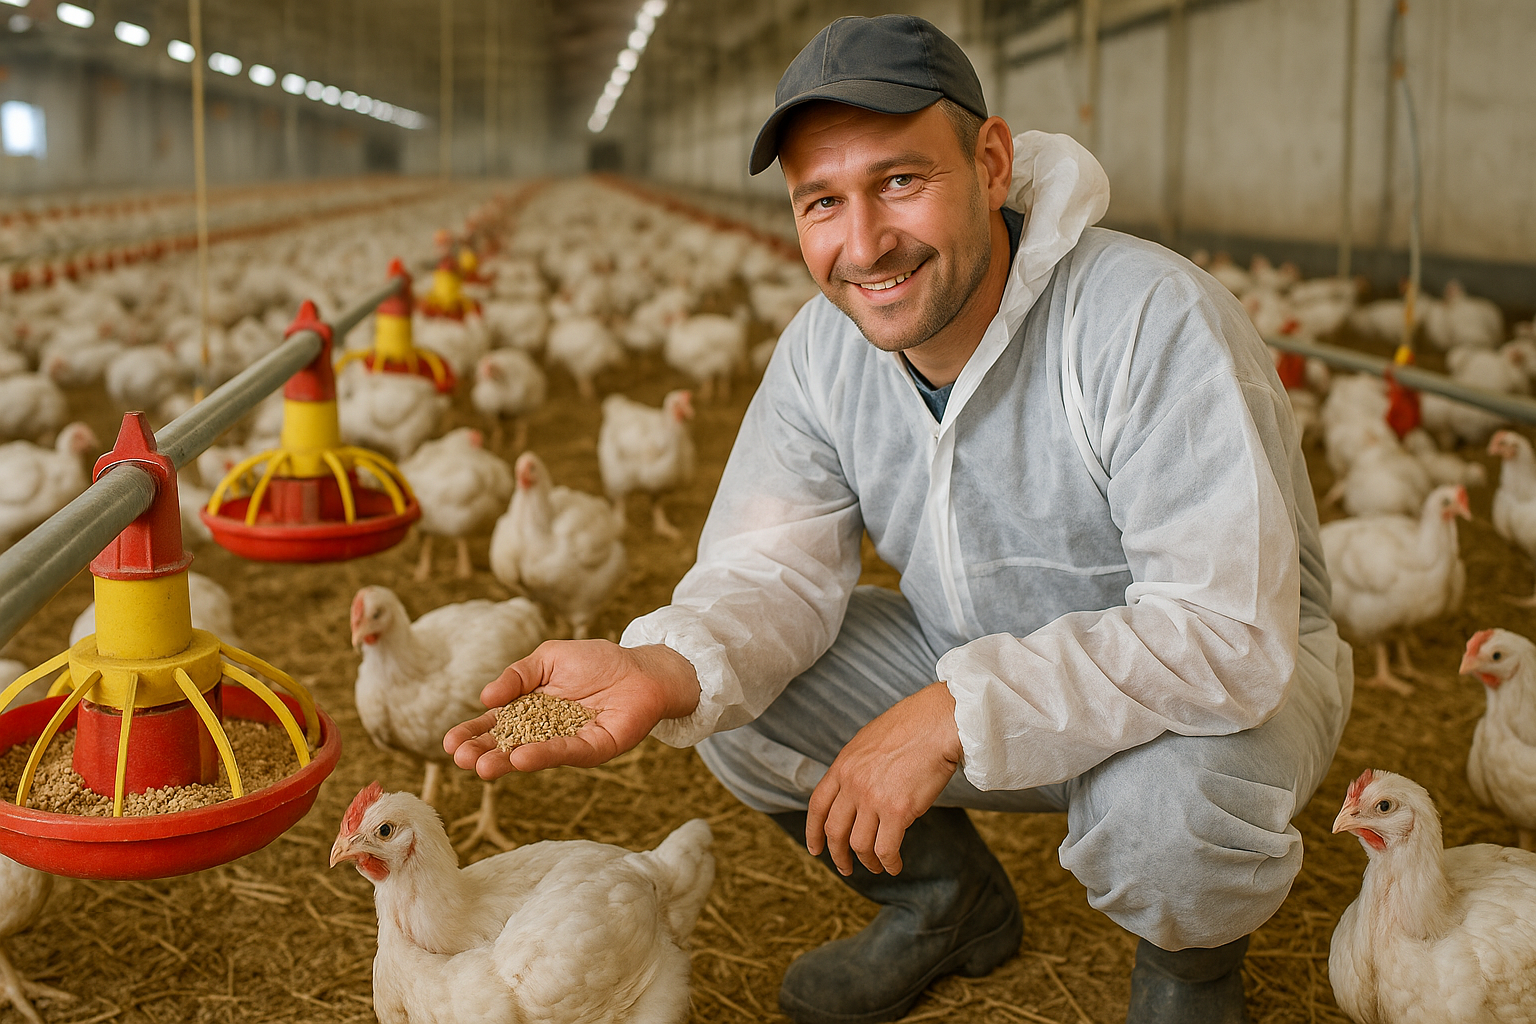


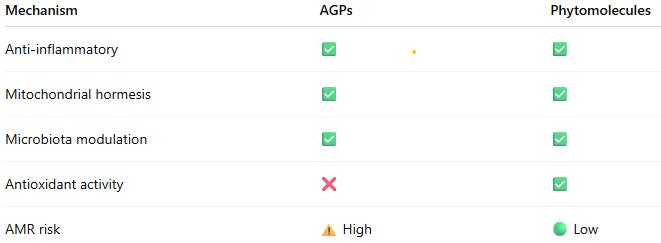
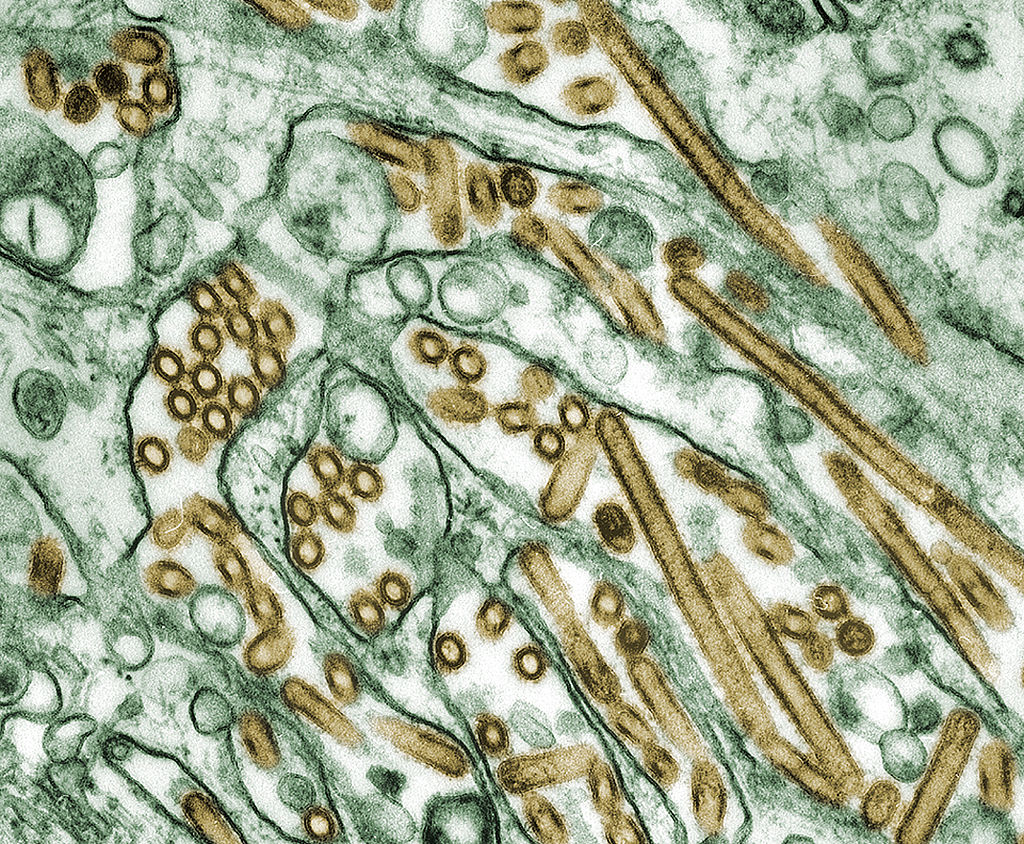


 .
.